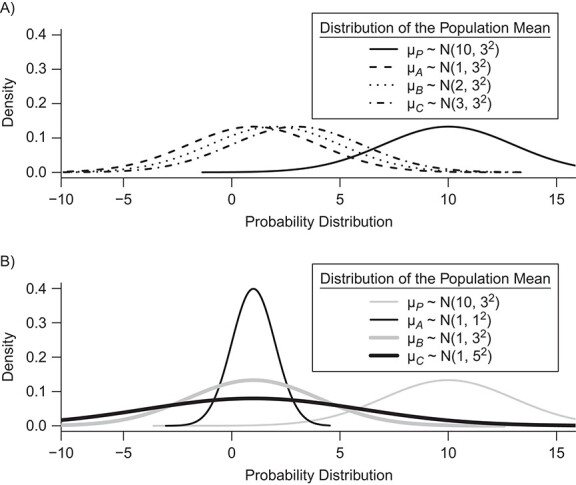
Figure 2.

Distributions of the absolute estimands ( ) of 3 active treatments (A, B, and C) and a placebo (P) with means
  and standard deviations SDi in a hypothetical example. A) Scenario 1; B) scenario 2.

Distributions of the absolute estimands ( ) of 3 active treatments (A, B, and C) and a placebo (P) with means
  and standard deviations SDi in a hypothetical example. A) Scenario 1; B) scenario 2.