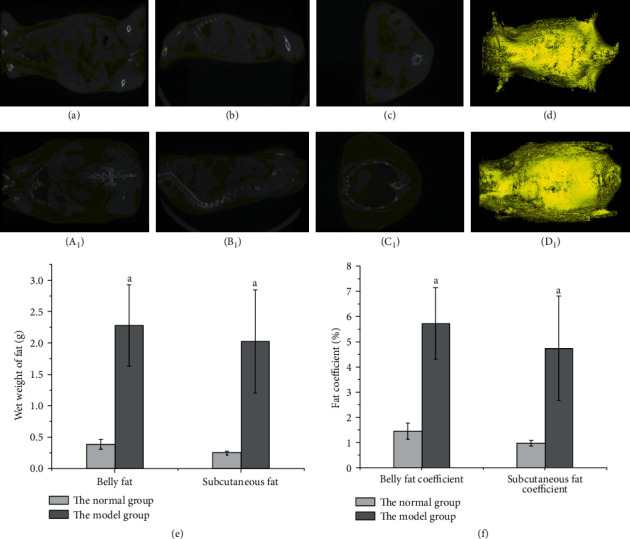
Figure 2.

Comparison of fat distribution, wet fat weight, and fat coefficient in the two groups of mice. Note. Yellow represents fat; white represents other tissues. (d) Stereogram of fat distribution in normal mice synthesized by (a), (b), and (c). (a) Upper section, (b) forward section, and (c) lateral section. (d1) Stereogram of fat distribution of model group mice synthesized by (a1), (b1), and (c1). (a1) Upper section, (b1) forward section, and (c1) lateral section. (e) The wet weight of the abdominal cavity and subcutaneous fat. (f) Abdominal and subcutaneous fat coefficients.
