
Figure 3.
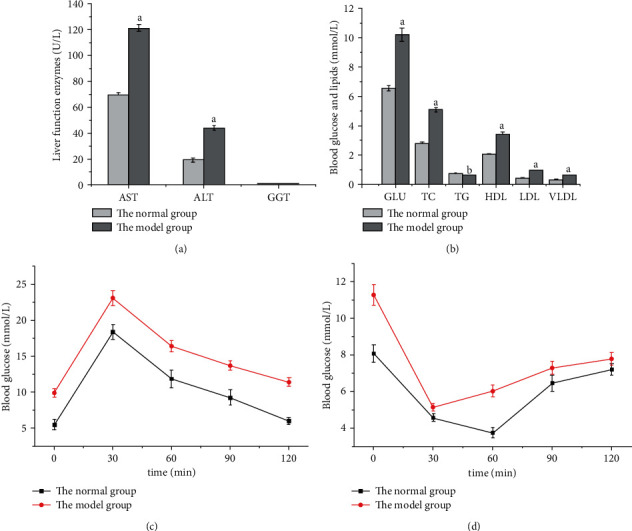
Comparison of liver enzyme tests, GTT, and ITT between model and normal groups. (a) Comparison of liver function enzyme levels. (b) Comparison of blood GLU and lipid levels. (c) Blood GLU changes in GTT. (d) Blood GLU changes in ITT.
Official websites use .gov
A
.gov website belongs to an official
government organization in the United States.
Secure .gov websites use HTTPS
A lock (
) or https:// means you've safely
connected to the .gov website. Share sensitive
information only on official, secure websites.
Comparison of liver enzyme tests, GTT, and ITT between model and normal groups. (a) Comparison of liver function enzyme levels. (b) Comparison of blood GLU and lipid levels. (c) Blood GLU changes in GTT. (d) Blood GLU changes in ITT.