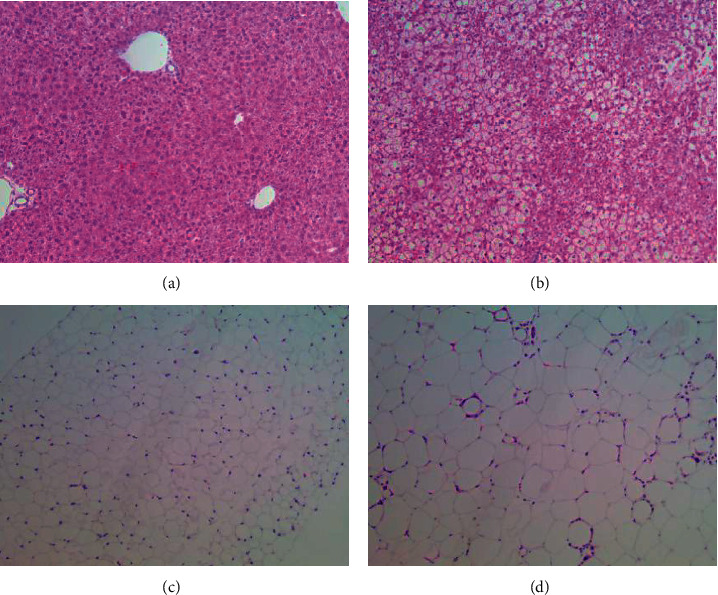
Figure 4.

Morphology and structure of the liver and adipose tissue in the two groups. (a) Liver structure in the normal group (HE, ×100). (b) Liver structure in the model group (HE, ×100). (c) Adipose tissue structure in the normal group (HE, ×100). (d) Adipose tissue structure in the model group (HE ×100).
