Figure 1.

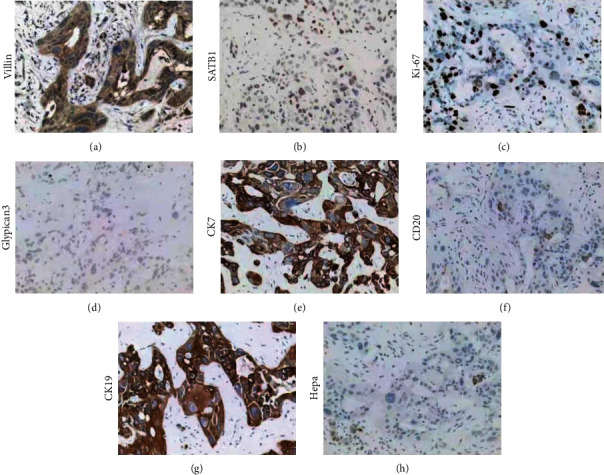
The typical expression images of Villin (a), SATB1 (b), Ki-67 (c), Glypican3 (d), CK7 (e), CK20 (f), CK19 (g), and Hepa1 (h).

The typical expression images of Villin (a), SATB1 (b), Ki-67 (c), Glypican3 (d), CK7 (e), CK20 (f), CK19 (g), and Hepa1 (h).