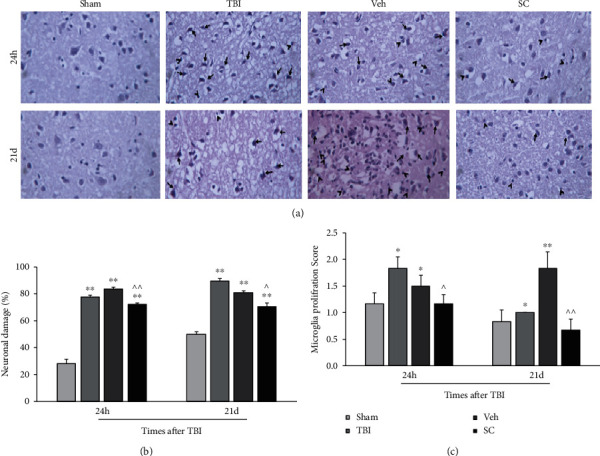
Figure 6.

Histopathological images (hematoxylin & eosin, 400×) in study groups, microglia proliferation (arrow tip) and neuronal damage (arrow) (a). Comparison of neuronal damage score (b) and microglia proliferation score (c) in study groups at 24 h and 21 days after injury (n = 6). Each bar represents mean ± SEM. ∗P < 0.05, ∗∗P < 0.01 compared with the sham group. ∧P < 0.05, ∧∧P < 0.01 compared with vehicle group. TBI: traumatic brain injury; Veh: vehicle; and SC: stem cell.
