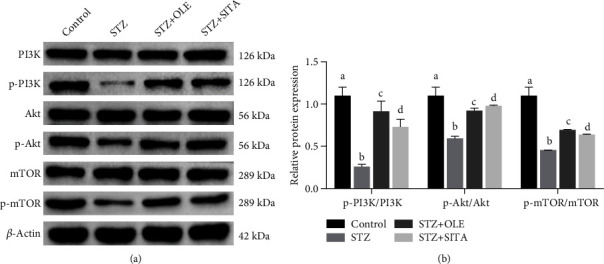
Figure 5.

The effect of oleuropein on the PI3K/Akt/mTOR signaling pathway in hippocampus tissue of diabetic rats. Western blot original images (a) and quantitative gray-scale analysis (b) of PI3K/Akt/mTOR signaling pathway-related proteins in the hippocampus tissues of rats. Each set contains data from 3 samples tested independently; LSD test was used for multiple comparisons. ∗∗p < 0.05 vs. control group and ##p < 0.05 vs. STZ group.
