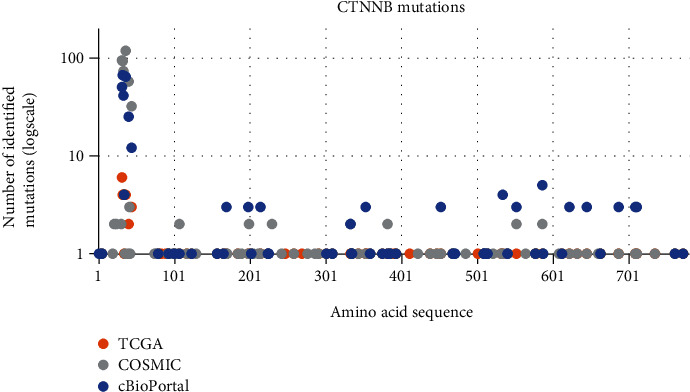
Figure 4.

Mapped mutations of CTNNB1 in EC based on available data from the TCGA, COSIMC, and cBioPortal databases. Diagram represents the number of identified mutations (logarithmic scale) of specific amino acid in the amino acid sequence of CTNNB1 gene. Exon 3 encodes for 75 amino acids (from 5th to 80th) where we can see a spike in the number of identified mutations in EC tumours. Other mutations are scattered throughout the whole gene, but few have been detected in more than one tumour sample.
