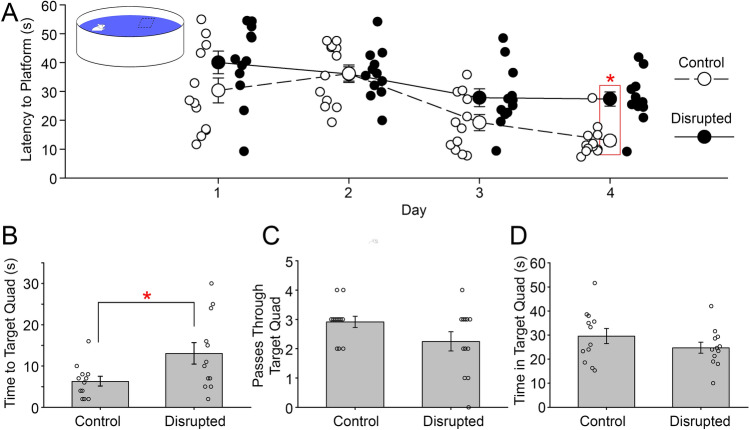
Figure 3.
The mean latency, in seconds, to the platform on the four training days of MWM task between the control and disrupted mice (A). The latency in seconds to the target quadrant between the control and the disrupted animals on the testing day (day 5) (B). The mean number of passing through the target area by the control and disrupted animals on the testing day (day 5) (C). The time spent in the target quadrant (quadrant 1) by control and disrupted animals on testing day (day 5) (D). The platform was located in quadrant 1 of the apparatus during training. Error bars represent the standard error of the mean. * = p < 0.05. N = 12/group.

