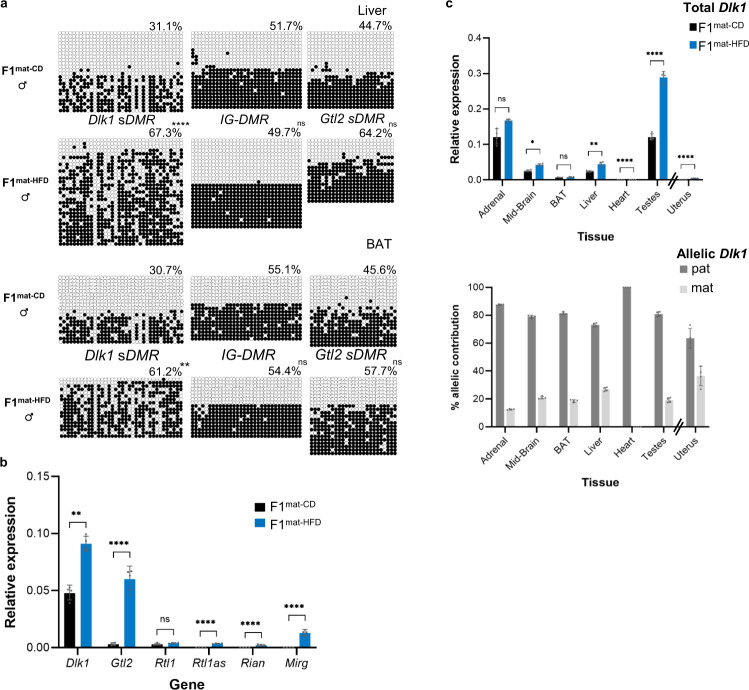
Fig. 4. Altered DNA methylation and allelic mis-expression of Dlk1 in offspring exposed to HFD in utero.
a DNA bisulphite methylation analysis at Dlk1 sDMR, IG-DMR and Gtl2 sDMR in liver (upper) and brown adipose tissue (BAT) (lower) from representative male P56 F1mat-CD and F1mat-HFD animals. In liver and BAT, hypermethylation was detected at Dlk1 sDMR, increased methylation was observed at the Gtl2 sDMR (not statistically significant), but IG-DMR was unchanged. Closed circles indicate methylated CpGs, open circles un-methylated CpGs. Each row represents an individual clone. Percentages indicate total methylation level of the region from two wt and two KImat animals. (Kolmogorov-Smirnov test comparing clonal methylation levels, using Holm-Šídák’s correction for multiple comparisons: **padj < 0.0055, ****padj = 6 × 10⁻⁶, ns=not significant). Source data are provided as a Source Data file. b Gene expression (QRT-PCR) at the Dlk1-Dio3 cluster in the liver of male P56 F1mat-HFD (blue) and F1mat-CD (dark grey) animals. Expression levels for this single tissue comparison were normalised to β-Actin expression. (Bars show the geometric mean of relative expression with geometric SD; N = 4 + 4 individual mice; unpaired two-sided t-tests on delta-Ct values with Holm-Šídák’s correction for multiple comparisons: **padj = 0.0067, ****padj < 0.0001, ns=not significant). Source data are provided as a Source Data file. c Dlk1 expression (QRT-PCR, upper panel) in different tissues from P56 male mice exposed to either control (F1mat-CD, black) or high-fat diet (F1mat-HFD, blue). Uterus samples from age-matched female mice were also analysed. Expression levels were normalised to β-Actin, 18S and Hprt. (Bars show the geometric mean of relative expression with geometric SD; N = 4 + 4 individual mice; Two-way ANOVA on delta-Ct values (Tissue p < 0.0001, Diet p < 0.0001, Interaction p < 0.0001); results of Holm-Šídák’s multiple comparisons follow-up test for effect of diet in each tissue are shown: *padj = 0.013, **padj = 0.0042, ****padj < 0.0001, ns=not significant). Allelic Dlk1 analysis in F1mat-HFD mice (lower panel), using primers that distinguish the reporter from the wt allele, showed a reduced contribution for paternal allele expression (dark grey) when compared to maternal allele expression (light grey). (Bars indicate the mean contribution from each allele ±SD; N = 4 + 4 individual mice). Source data are provided as a Source Data file.

