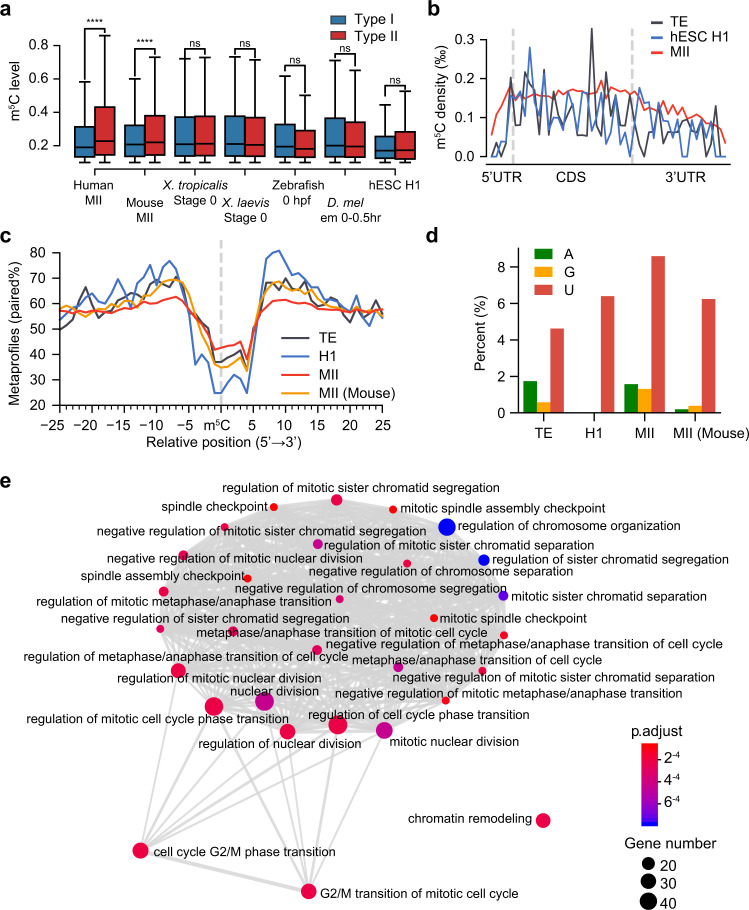
Fig. 4. Trans-regulatory innovation leads to the gain of thousands of human-specific Type II sites.
a Comparison of the levels of Type I and Type II sites in selected samples that represent maternal mRNA methylation status in different species and in hESC H1 that represents human zygotic mRNA methylation status. Note that in mouse oocyte samples, only 3.9% of the sites were Type II sites. Boxplots: 25th to 75th percentiles (boxes), medians (horizonal lines), and 1.5 times of the interquartile range (whiskers). The P-values were calculated using one-sided Student’s t-test. ****p < 0.0001; ns, not significant. From left to right: Type I sites: 26625, 19652, 15994, 14554, 4557, 4907, 312; Type II sites: 8388, 1042, 2530, 1679, 138, 482, 125; P-values: 2.61e-151, 0.184, 1.18e-6, 0.527, 0.931, 0.93, 0.914. b The distribution of Type II m5C sites in human MII oocytes, hESC H1, and human TE. The density was first calculated as in Fig. 1d and then normalized to the bin with the highest density. c The metaprofiles of the secondary structure of Type II m5C sites and flanking regions in human MII oocytes, hESC H1, human TE, and mouse MII oocytes. d Base composition at position +3 of the core motif for Type II sites in human MII oocytes, hESC H1, human TE, and mouse MII oocytes. e Enrichment map plot (see Methods) for genes that were only regulated by NSUN6 in human MII oocytes. The top 30 terms were shown. Source data are provided as a Source Data file.

