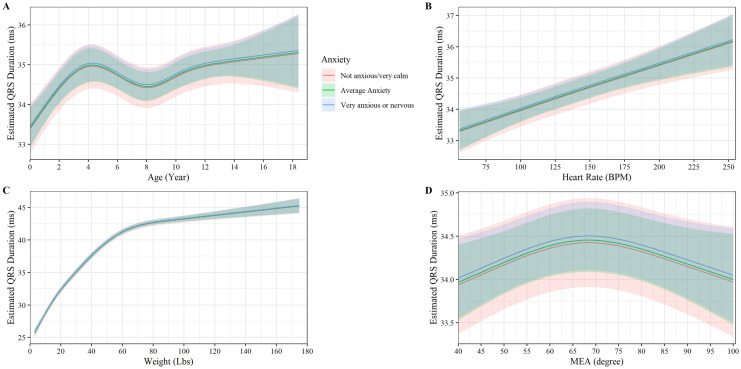
Figure 4.
Plot of the QRS-wave duration (ms) versus (A) age, (B) heart rate, (C) weight, (D) MEA by anxiety. The y axis shows the estimated QRS -wave duration from the fully adjusted model for observed values while holding the values of covariates at their referent values. The curves display the trend in QRS-wave duration with increase age, heart rate, weight, and MEA. Shaded regions represent the 95% confidence interval of the prediction estimates from the regression model.

