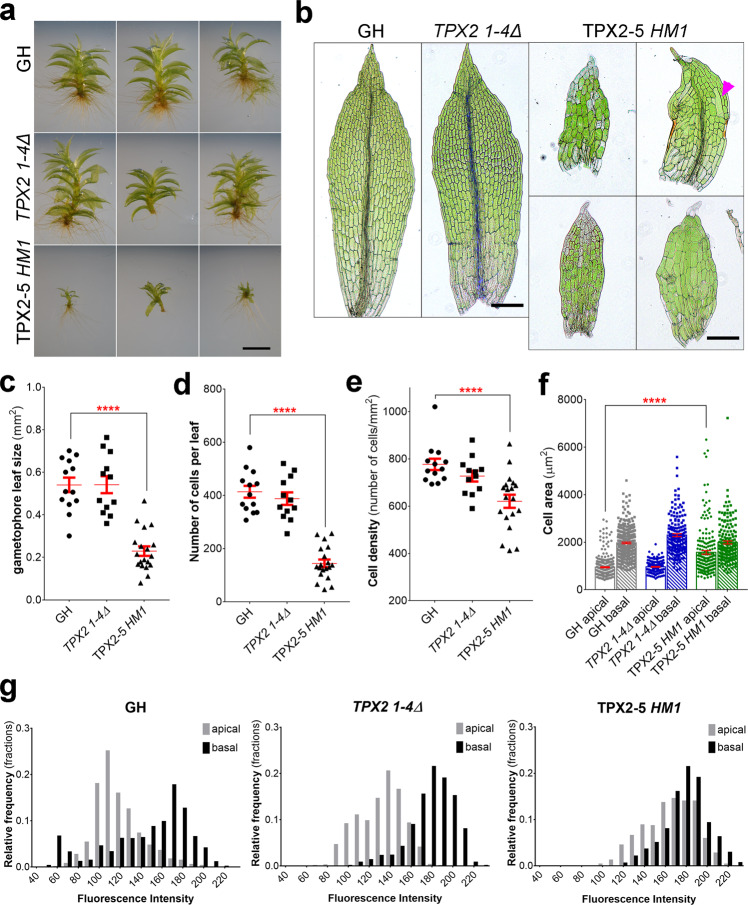
Fig. 3. Abnormal gametophore and leaf development in the TPX2-5 HM1 mutant.
a Representative images of gametophores after 4 weeks of culture of GH (control), TPX2 1-4Δ, and TPX2-5 HM1 lines. Brightness/contrast have been linearly adjusted. An extended version is presented in Supplementary Fig. 3. Experiment was repeated three times with similar results. Bar, 2 mm. b Representative images of gametophore leaves of GH, TPX2 1-4Δ, and TPX2-5 HM1 lines. The magenta arrowhead indicates abnormally large cell occasionally observed in the TPX2-5 HM1 line. Bar, 200 µm. c Gametophore leaf size (mm2), d number of cells per leaf, e cell density (number of cells per mm2), f cell area (µm2) of the apical and basal sides of the gametophore, measured in gametophore leaves collected after 3 weeks of culture with n = 13, 12, and 19 for GH, TPX2 1-4Δ, and TPX2-5 HM1 lines, respectively (mean ± SEM, ****p = 0.0001 by one way ANOVA with Dunnett’s multiple comparison test against GH). Apical and basal sides correspond to 1/3 of leaf length at the tip and at the base, respectively. g Quantification of the nuclear DNA content in the interphase nucleus of gametophore leaf cells (from apical and basal sides). DNA amounts were measured as fluorescence intensity (arbitrary unit) of the DAPI-stained nuclei per cell without background subtraction. GH and TPX2 1-4Δ lines have two ploidy peaks corresponding to apical and basal sides of gametophore leaves; In the TPX2-5 HM1 line, the difference in ploidy is less pronounced.

