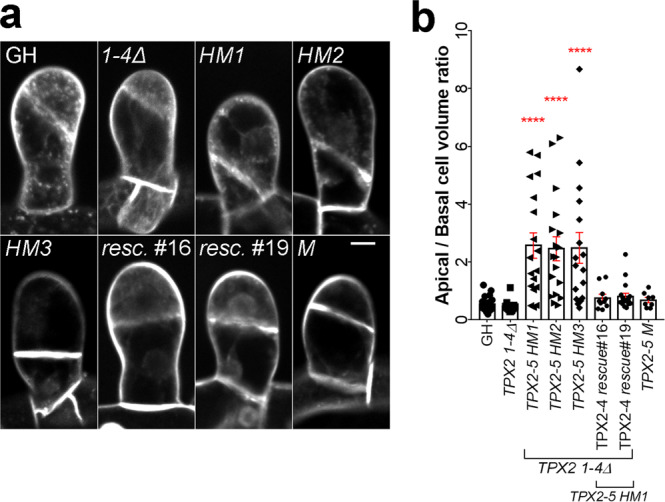
Fig. 4. Abnormal cell plate positioning in the gametophore initials of the TPX2-5 hypomorphic mutants.

a Gametophore initial at the 2-cell stage stained with FM4-64 dye. Bar, 10 µm. b The apical/basal cell volume ratio was estimated as the apical cell volume divided by the basal cell volume, measured during the 2-cell stage (mean ± SEM, ****p = 0.0001 by one way ANOVA with Dunnett’s multiple comparison test against GH). n = 22, 15, 18, 18, 17, 10, 18, and 8 for GH, TPX2 1-4Δ, TPX2-5 HM1, TPX2-5 HM2, TPX2-5 HM3, TPX2-4 rescue#16, TPX2-4 rescue#19 and TPX2-5 M.
