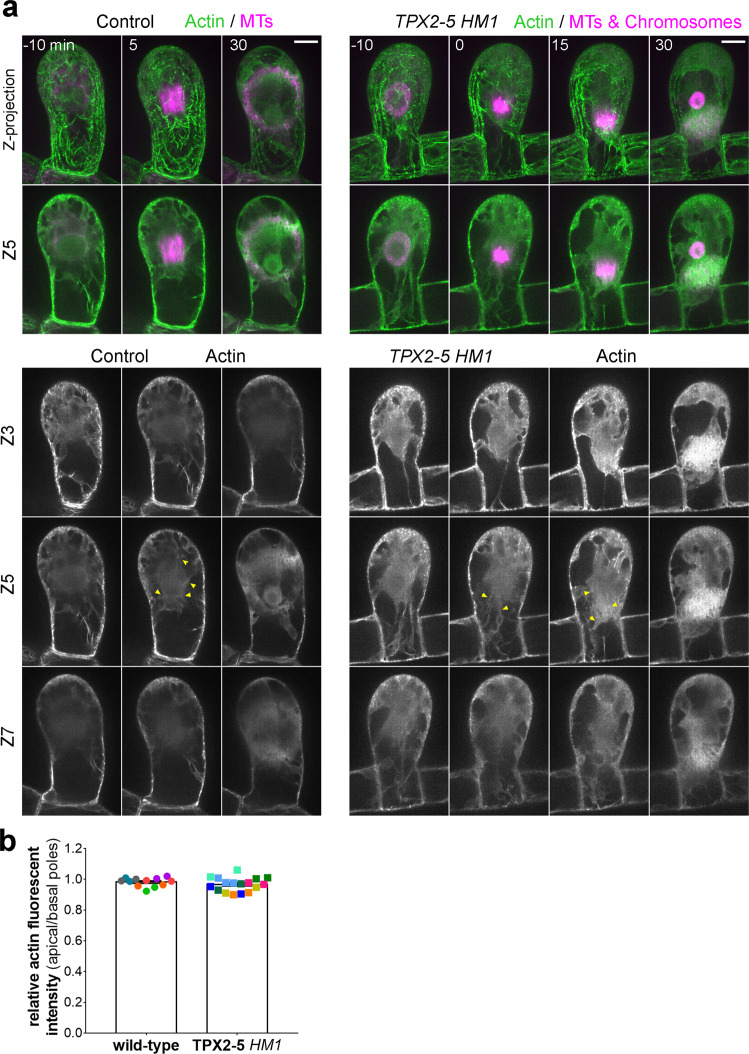
Fig. 6. Actin is present in the cytoplasm and cortex during spindle motility in the TPX2-5 HM1 line.
a Live-cell imaging of Citrine-F-tractin (actin, green) during the first asymmetric division in the gametophore initial cells also expressing mCherry-tubulin (magenta, MTs). TPX2-5 HM1 cells additionally expressed mCherry-tubulin/H2B-RFP (magenta, chromosomes), which was brighter than mCherry-tubulin. Maximum intensity projection of Citrine-F-tractin (20 µm with 2.5 µm steps) and single focal frame of mCherry-tubulin were merged in the “Z-projection” panels. Three Z frames are also presented (z = 3, 5, and 7). Yellow arrowheads indicate filamentous or punctate signals of cytoplasmic actin. Time 0 (min) was set at NEBD. Bar, 10 µm. b Relative actin fluorescent intensity (basal/apical poles). Mean gray values of Citrine-f-tractin were measured at the apical and basal pole of the spindle in a square of a fixed size (8 × 4 µm) for each of the Z-slices and summed to get intensity at each pole. Dots of the same color represent measurements obtained from the same cell at different time points (n = 6 and 8 for wild-type and TPX2-5 HM1, respectively).

