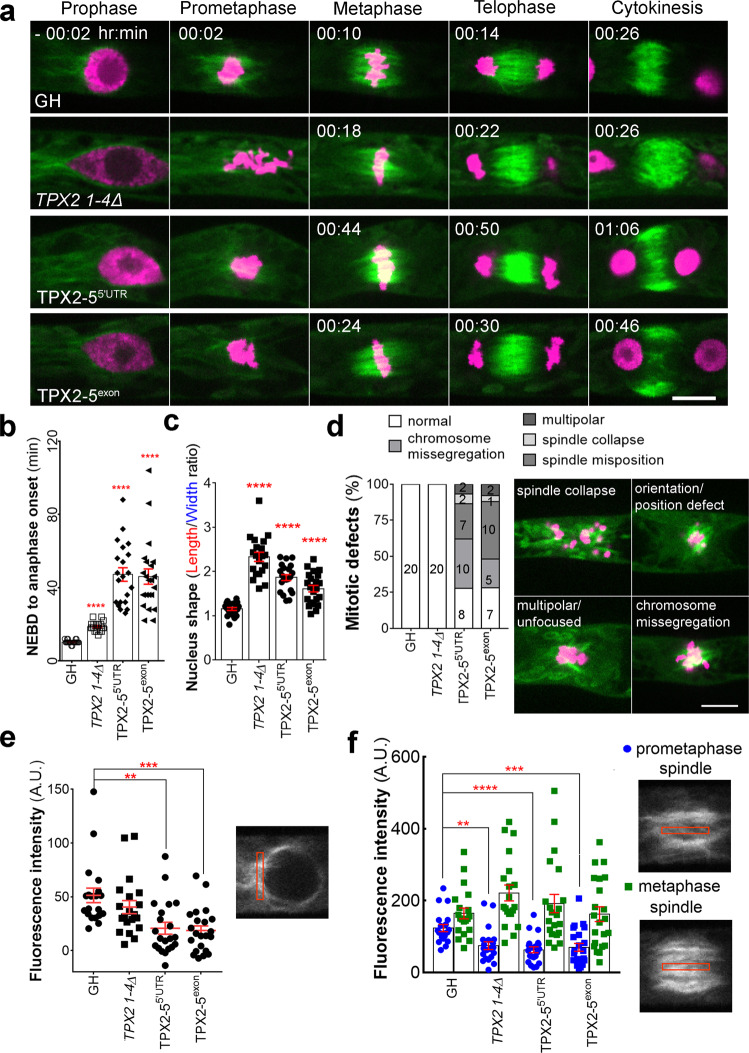
Fig. 7. TPX2 contributes to microtubule amplification in early mitosis.
a Representative images of the mitosis of protonemal apical cells in GH (control), TPX2 1-4Δ, TPX2-55’UTR RNAi, and TPX2-5exon RNAi lines. Time 0 (min) was set at NEBD. Green, GFP-tubulin; Magenta, histoneH2B-mRFP. Bar, 10 µm. b Mitotic duration calculated from NEBD to anaphase onset (mean ± SEM; ****p < 0.0001, two-tailed Student’s t-test). Live-cell imagining was repeated three times with similar results. c Nucleus shape prior to NEBD, measured as a ratio of nucleus length to nucleus width (mean ± SEM; ****p < 0.0001, two-tailed Student’s t-test). d Frequency and type of mitotic defects observed. Numbers within the columns indicate number of cells with corresponding phenotypes. Bar, 10 µm. e Fluorescence intensity of perinuclear MTs (mean ± SEM; **p = 0.0011, ***p = 0.0002; two-tailed Student’s t-test). A.U. stands for Arbitrary Units. f Fluorescence intensity of MTs in the prometaphase spindle (4 min after NEBD) and metaphase spindle (2 min before anaphase onset), measured from a single focal plane, with the cytoplasmic background subtracted. A decrease in fluorescence intensity was detected in prometaphase, but not in metaphase spindles (mean ± SEM **p = 0.0018, ****p = 0.00002, ***p = 0.0008; two-tailed Student’s t-test). For graphs b–f, number of independent cells observed n = 20 for GH and TPX2 1-4Δ lines, n = 21 for TPX2-55’UTR, and n = 22 for TPX2-5exon RNAi lines.

