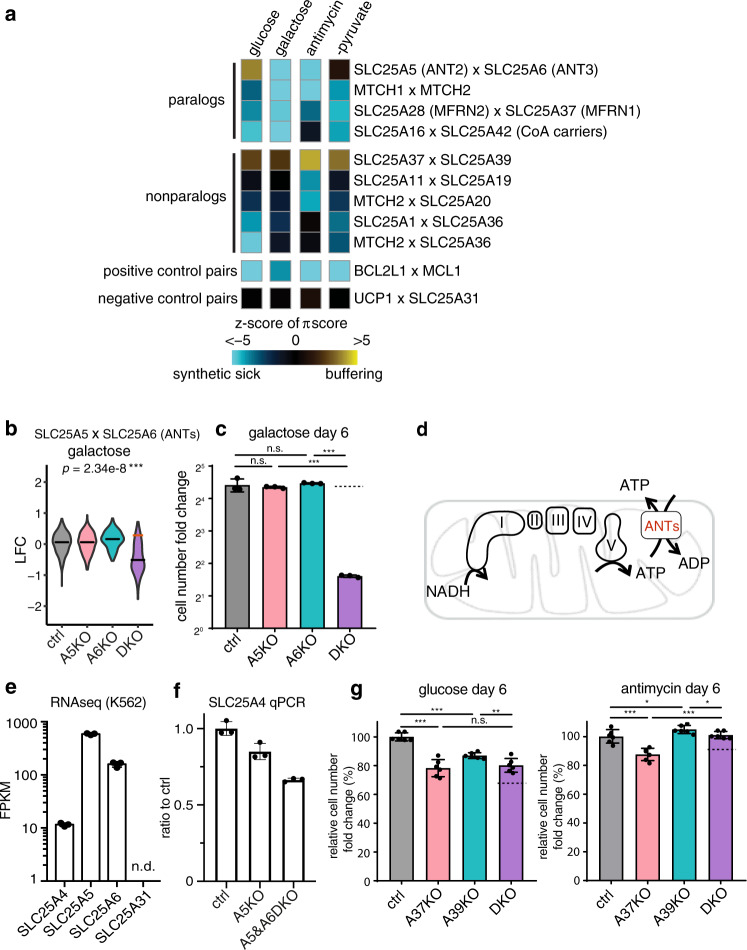
Fig. 3. Identification of Gene x Gene x Environment (GxGxE) interactions.
a Heatmap shows the π-score for pairwise genetic interaction. The values are z-transformed to compare across media conditions, as described in the methods. For comparison, a positive control pair (BCL2L1 x MCL1) that are always detrimental when jointly knocked out and another pair (UCP1 x SLC25A31) that do not interact are shown. The rows and columns are not clustered. b LFC values from the CRISPR screen are shown to illustrate the strongest synthetic sick genetic interaction observed from the CRISPR screen, SLC25A5 and SLC25A6 loss in the galactose condition. The red line indicates the expected LFC, based on an additive model, if there were no genetic interaction. The black line indicates the actual median LFC value. c Follow-up validation of the genetic interaction between SLC25A5 and SLC25A6 in the galactose (pctrl/A5KO = 0.59, pctrl/A6KO = 0.66, pA5KO/DKO = 2.11 × 10⁻⁷, pA6KO/DKO = 1.93 × 10⁻⁸). The dotted line indicates the expected growth fitness, based on an additive model, if there were no specific genetic interaction (n = 3). d The cartoon illustrates the function of ANTs in supporting bioenergetics. e Transcript levels of the four ANTs in K562 cells (data plotted from the published PBS vehicle treated K562 cells RNA-seq dataset GSE74999) (n = 3). f qPCR of SLC25A4 mRNA level in SLC25A5 KO and SLC25A5 and SLC25A6 DKO cells (n = 3). g Follow-up validation of the genetic interaction between SLC25A37 and SLC25A39 in the glucose (pctrl/A37KO = 1.04×10⁻⁵, pctrl/A39KO = 3.08×10⁻⁶, pA37KO/DKO = 0.56, pA39KO/DKO = 0.0092) and antimycin (pctrl/A37KO = 0.00074, pctrl/A39KO = 0.0498, pA37KO/DKO = 5.54×10⁻⁵, pA39KO/DKO = 0.030) conditions (n = 6). Statistical significance was calculated using two-tailed t test. Significance level were indicated as *** p < 0.001, ** p < 0.01, * p < 0.05 and n.s. p > 0.05. Data are expressed as mean ± SD. Source data are provided as a Source Data file.

