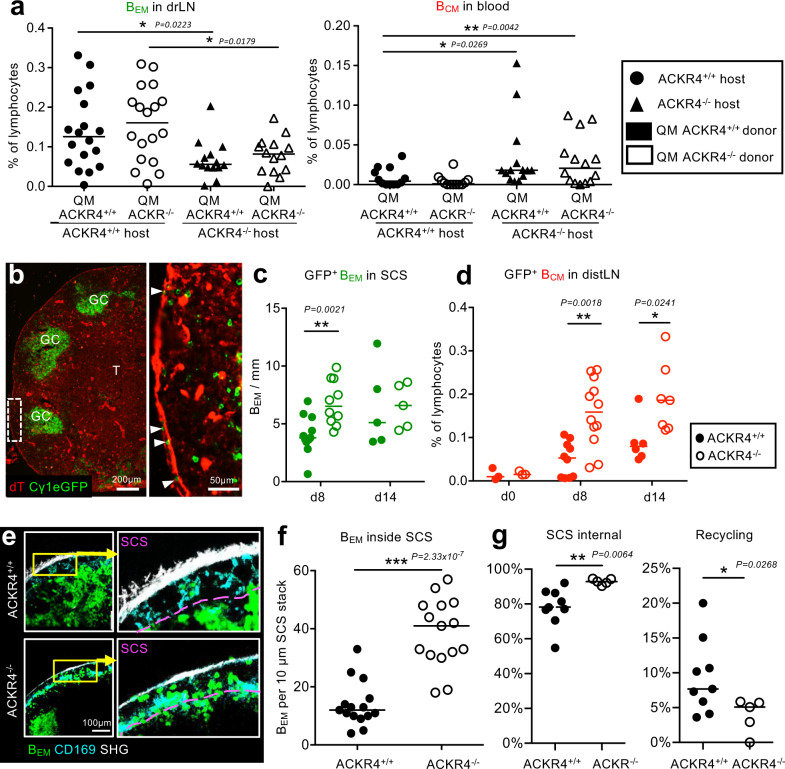
Fig. 4. Local ACKR4-generated chemokine gradients at the SCS direct migration of memory B cells.
a Frequency of QM ACKR4+/+ and QM ACKR4−/− BEM in drLN or BCM in blood of ACKR4+/+ and ACKR4−/− hosts. Data merged from three independent experiments with 4–5 mice each. Two-tailed Mann-Whitney test. b drLN from an Cγ1-Cre mTmG mouse 8 d after immunization. Arrows: eGFP+ BEM inside the SCS. Representative image of nine lymph nodes. c eGFP+ BEM in the SCS of drLN in Cγ1Cre mTmG ACKR4+/+ or ACKR4−/− mice at d8 and d14 after foot immunization. d BCM in distLN in ACKR4+/+ or ACKR4−/− mice after foot immunization. Data in c and d are merged from two independent experiments with 3–5 mice each. Two-tailed Mann-Whitney test. e Intravital observation of BEM entry into SCS in Cγ1Cre mTmG ACKR4+/+ or ACRK4−/− drLN. f Quantitation of intravital eGFP+ BEM in SCS of ACKR4+/+ or ACKR4−/− drLN. Each dot represents cell counts per field of view of a 10 μm Z stack. Pooled data from imaging of three ACKR4+/+ and two ACKR4−/− popliteal LNs. Two-tailed unpaired t test, ***P = 2.33 × 10⁻⁷. g Automated B cell tracking showing fraction of BEM tracks that are inside the SCS or recycling from the SCS into the lymph node parenchyma. Images from five ACKR4+/+ and 2 ACKR4−/− popliteal LNs were analyzed. Each symbol corresponds to the average fraction of tracks from one video, total n of tracks = 2478. One-tailed unpaired t test, *p = 0.0268; **p = 0.0064.

