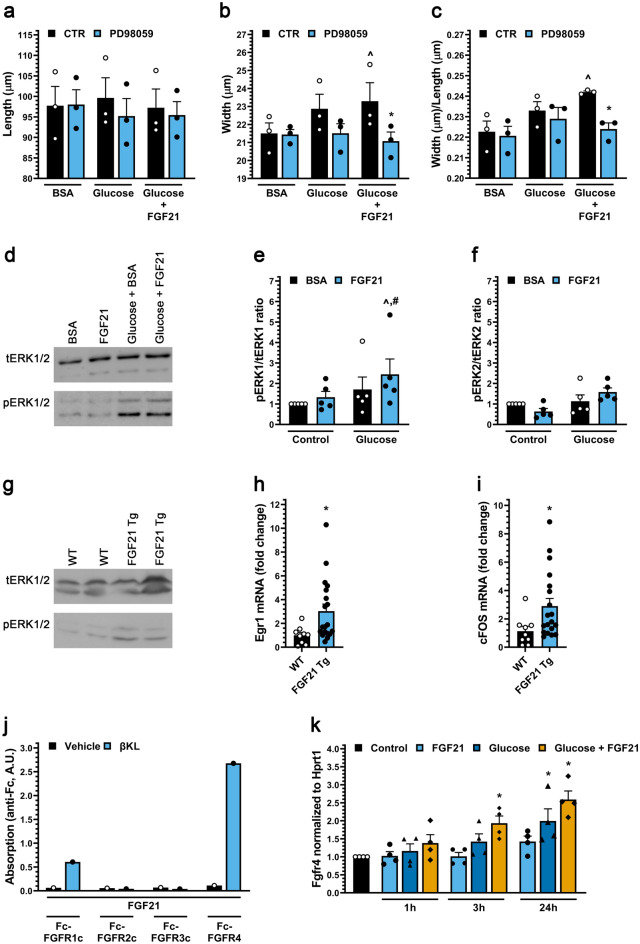
Figure 3.
FGF21 activates ERK1/2 in cultured cardiac myocytes in the presence of high glucose and in heart tissue of mice. (a–c) Length, width and width to length ratio for ARVMs treated with BSA (control), FGF21 (25 ng/ml), increased glucose and/or the MEK inhibitor PD98059 (20 µM) for 48 h. Bars and colored symbols indicate average mean and means of independent experiments using different myocyte preparations, respectively. (d–f) Western blot analysis of ARVMs treated with BSA (control) or mouse recombinant FGF21 (25 ng/ml) with or without 10 mM glucose for 6 h. ERK1 is p44 and ERK2 is p42. (g) Analysis of cardiac tissue from FGF21 Tg mice and wild-type littermates at 8–12 weeks of age by Western blotting. (h, i) qRT-PCR for Egr-1 and c-Fos mRNA using total RNA from heart tissue of FGF21 Tg mice and wild-type littermates at 8–12 weeks of age. (j) Binding of 1 µg of soluble β-klotho (βKL) or PBS, 500 ng of Fc-tagged FGFR 1c, 2c, 3c, or 4 to 96-well plates coated with 200 ng of FGF21. (k) qRT-PCR for FGFR4 mRNA using total RNA isolated from ARVMs treated with BSA (control), FGF21 (25 ng/ml), and/or increased glucose (15.6 mM total). Comparison between groups was performed in form of a one-way (a–c, k) or two-way (e–f) ANOVA followed by post-hoc Tukey test or a two tailed t-test (h, i). All values are expressed as mean ± SEM. (a–c) N = 3, ^p ≤ 0.05 vs. BSA CTR, *p ≤ 0.05 vs. Glucose + FGF21 CTR; (e, f) N = 5, ^p ≤ 0.05 vs. BSA CTR, #p ≤ 0.05 vs. FGF21 CTR; (h, i) N = 9−19, *p ≤ 0.05 vs. WT; (k) N = 4, *p ≤ 0.05 vs. CTR. All Western blots are cropped, and original blots are presented in Supplementary Fig. 3.

