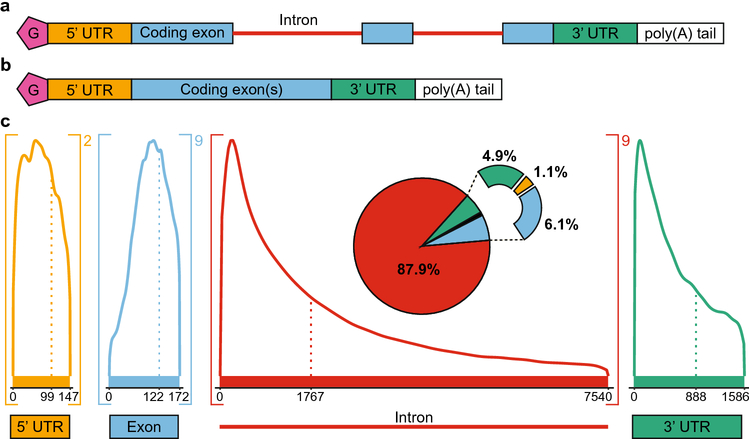
Fig 1.
RNA composition and length distributions. a. Precursor mRNA (pre-mRNA) is transcribed from DNA. Pre-mRNA typically contains a 5’ cap (pink, G), a 5’ untranslated region (UTR, orange), coding exons (blue), intervening introns (red), a 3’ untranslated region (green), and a polyadenylated tail (poly(A) tail, white). b. RNA splicing creates mature mRNA by removing introns. c. Length distributions of the components of the transcriptome. The dotted line represents the median length of each component, whereas the maximum value shown on the graph denotes the average length. Values greater than the average are not shown due to the extremely long outliers that skew the distribution. The number outside brackets indicates the average number of times a component occurs in a transcript. The pie chart breaks down the relative amount of sequence space of each component, accounting for length.

