Fig 5.
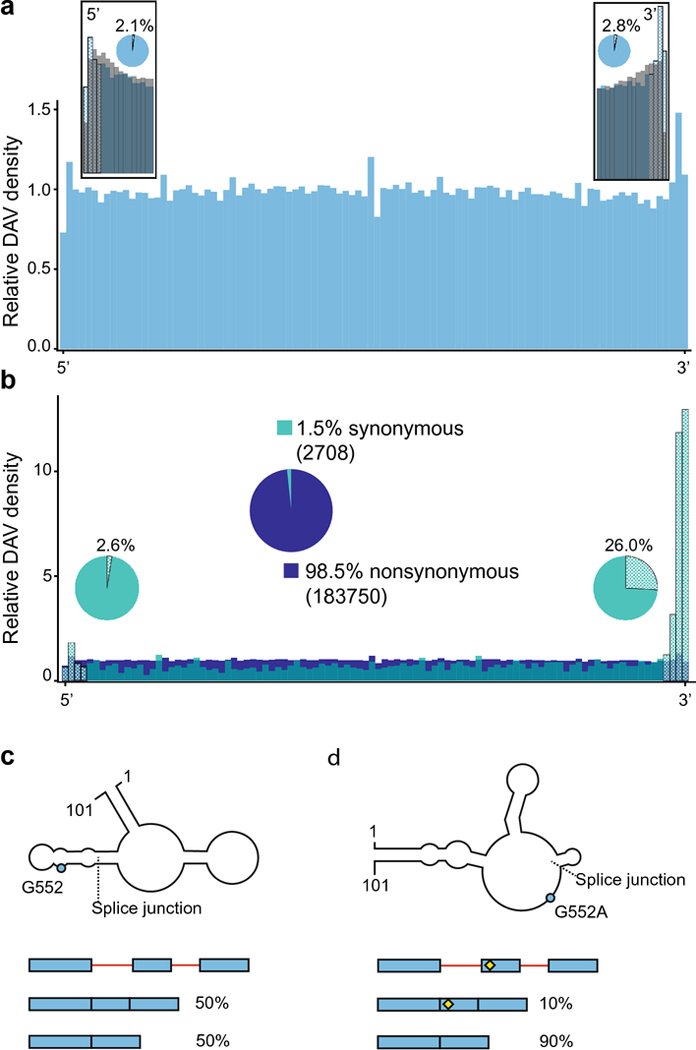
Disease associated variants in exons. a. Exonic DAV distribution (blue), with inset boxes showing the relative abundance of DAVs (blue) against common SNPs with a MAF >= 0.01 (gray) at the 5’ and 3’ ends of exons. The checkered bars indicate potential post-transcriptional regulatory motifs around the splice sites. The pie charts show the proportion of transcripts with a DAV at the splice sites, within 3 nucleotides of each end. b. Exonic DAVs divided into synonymous (blue-green) and nonsynonymous (dark blue). The large, centered pie chart shows the relative abundance of synonymous versus nonsynonymous DAVs in exons, with the absolute number of mutants in parentheses. Nonsynonymous DAVs are found at a uniform distribution across the length of the exon, whereas the synonymous DAVs are enriched at the 3’ end of exons. The smaller pie charts near each end of show the proportion of transcripts with a synonymous DAV in a post-transcriptional regulatory motif compared to all synonymous DAV-containing transcripts. c. The RNA secondary structure of a 101-nucleotide section of the mature PNPO transcript is shown, with the splice junction between exons 4 and 5 marked. The schematic below the structure illustrates how the PNPO gene exhibits a mixture of alternative splicing events showing both exons (blue) and introns (red), where splice isoforms are approximately equally distributed in the wild-type background. d. The mutation of G552A (rs4378657), just 6 nucleotides from the splice junction at the 5’ end of exon 5, creates a riboSNitch in PNPO (blue dot) by disrupting the binding of the TARDBP RNA binding protein, which results in exon skipping. The SNP is shown in the splicing schematic with a yellow diamond.

