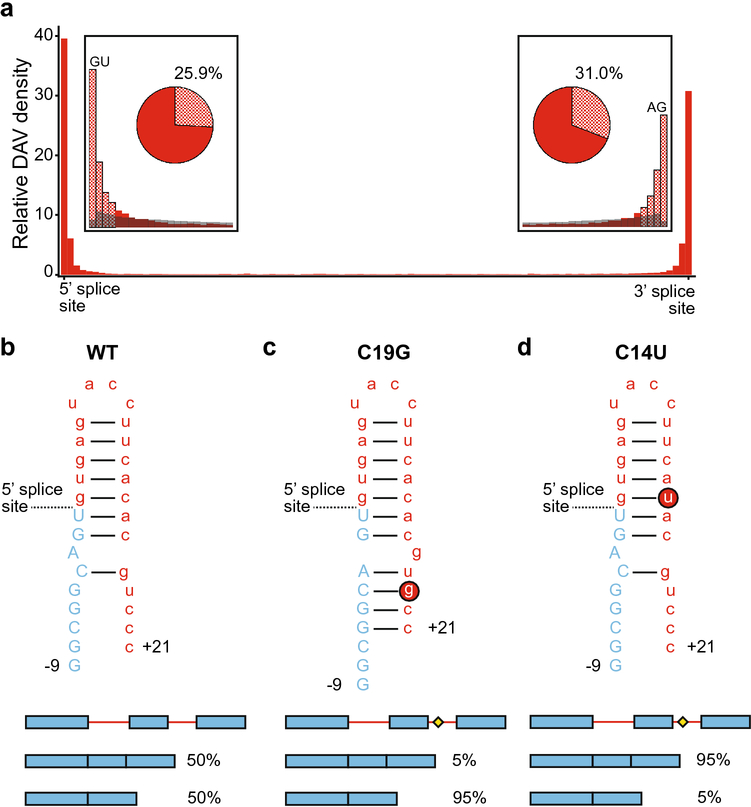
Fig 6.
Disease associated variants in introns. a. Intronic DAV distribution is shown in red, where intronic DAVs are dramatically more abundant around splice sites. Note the differing scale from Fig 2. The insets compare the DAV frequency (red) and the common SNP frequency (gray) at the very 5’ and 3’ ends of introns. The checkered bars indicate the approximate location of post-transcriptional regulatory motifs. The pie charts show the proportion of transcripts containing an intronic DAV in a post-transcriptional regulatory motif (i.e. within 6 nucleotides of the 5’ splice site, or 35 nucleotides of the 3’ splice site). b. The MAPT transcript RNA forms a hairpin structure between exon 10 (blue, uppercase) and the following intron (red, lowercase), shown here as nucleotides and numerically labeled from the splice site, where the upstream exon nucleotides are labeled with a minus (−9) and the downstream intron nucleotides are labeled with a plus (+21). MAPT RNA splices as a roughly even mixture of splice isoforms skipping or retaining exon 10, shown as the schematic below with exons (blue) and introns (red), where accumulation of the exon-inclusion isoform is associated with disease phenotypes. c. The rs63750162 mutation of C to G at +19 (C19G, red circled G) creates a riboSNitch shifting the splice isoforms to favor exon skipping. The splicing diagram shows the DAV SNP as a yellow diamond. d. The rs63750972 mutation of C to U at +1 (C14U, red circled U) minimally changes the RNA structure but weakens the hairpin strength, shifting the isoform ratio to favor exon inclusion.

