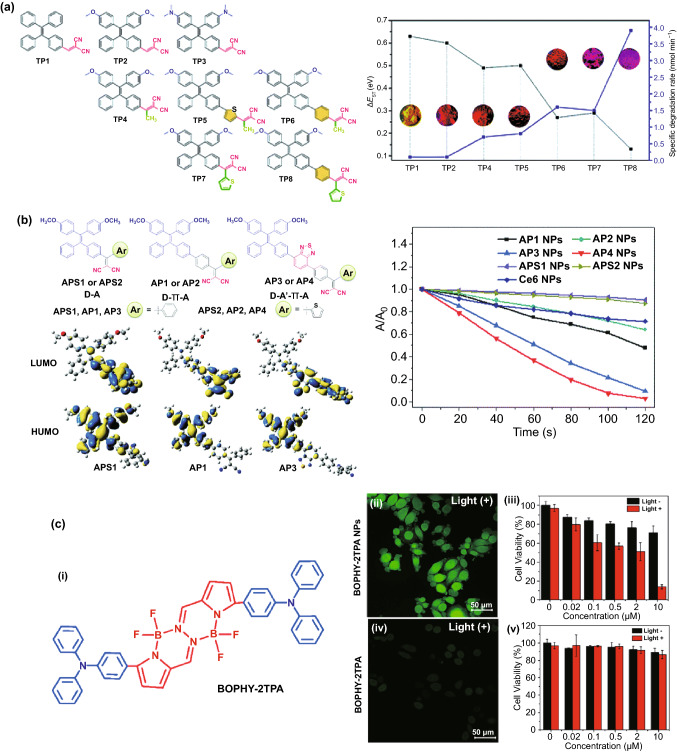
Fig. 5.
a Left: Chemical structure of different Type II AIE photosensitizers, Right: The ΔEST values (black curve), specific degradation rates (degradation rate per absorption area of the PS, 400–700 nm) and solid power images under 365 UV light illumination (inset), reproduced from Ref. [95] with permission from Royal Society of Chemistry. b Left: Chemical structures and HOMO–LUMO distributions, and Right: relative degradation of 9,10-anthracenediyl-bis(methylene) dimalonic acid (ABDA) in the presence of different photosensitizers, reproduced from Ref. [97] with permission from Royal Society of Chemistry. c (i) Chemical structure of BOPHY-2TPA AIE photosensitizer molecule, (ii) fluorescence image of intracellular ROS generation in HeLa cells detected by DCFH-DA as singlet oxygen probe, and HeLa cell viability by (ii, and iii) BOPHY-2TPA nanoparticles and (iv, v) BOPHY-2TPA molecule, reproduced from Ref [99]. with permission of American Chemical Society. (Colour figure online)

