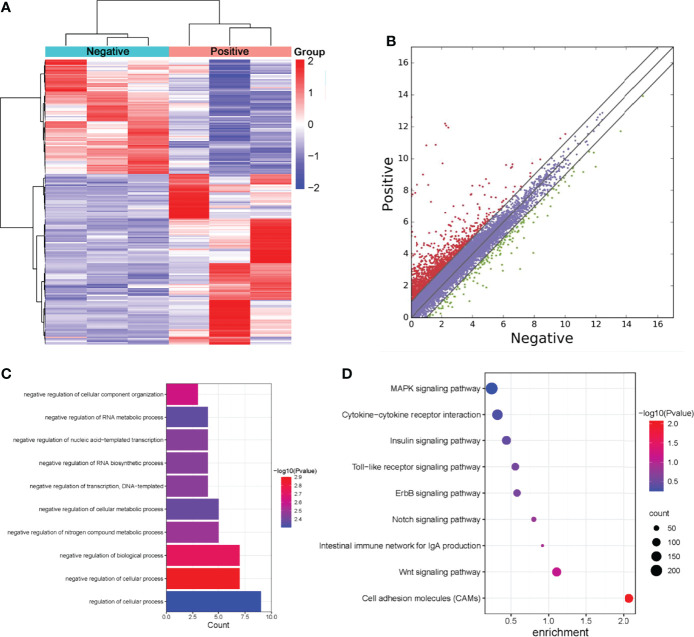
Figure 4.
Screening of differentially expressed genes in normal livers and ALV-J induced tumor livers by RNA-seq. (A) Heatmap of RNA-seq data in two groups. Rows: mRNAs; columns: ALV-J infected positive and negative groups. Red, black, and green indicate the up-regulation, unchanged, and down-regulation of mRNAs, respectively. (B) Differentially expressed mRNAs in ALV-J infected positive and negative groups. Red dots represent up-regulated genes in the positive group compared with the negative group, green dots represent down-regulated genes, and blue dots represent genes with no significant differences. (C) GO enrichment of biological processes involved in up-regulated genes in the positive group compared to the negative group. (D) Pathway analysis of up-regulated genes in the positive group. Negative represents chickens without ALV-J infection (normal livers); Positive represents chickens with ALV-J infection (tumor livers).

