. 2019 Oct 7;9(54):31781–31796. doi: 10.1039/c9ra04619d

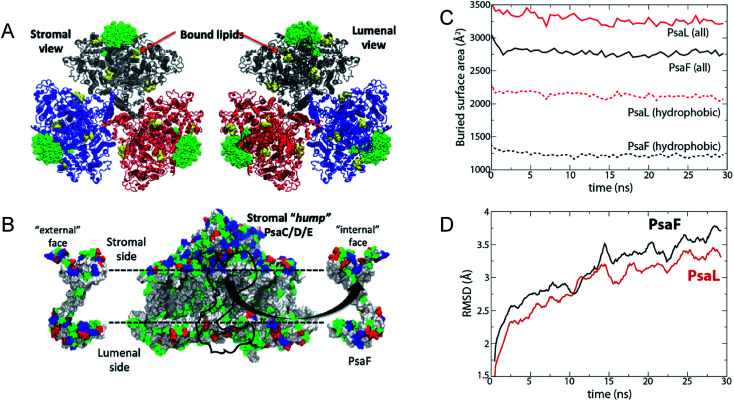
Fig. 9. Simulated interaction energy analysis of PsaF bound to PSI. Simulated system. (A) The three units of the PSI trimer are shown in blue, grey, and red, respectively. PsaF from each unit is highlighted in a green, space-filling representation. Co-crystallized lipids are shown in yellow; although they were present in the simulation, chlorophylls, carotenoids, and iron–sulfur clusters are not shown. (B) PsaF interactions. On the left and right are the outward- and inward-facing sides of PsaF, respectively. Its position on the rest of the PSI monomer is indicated by a black outline on the central image. Residues are colored according to polarity: blue (basic), red (acidic), green (polar, uncharged), and white (hydrophobic). The horizontal dotted lines indicate the position of the membrane. (C) Total (solid lines) and hydrophobic (dotted lines) buried surface area averaged over three copies of PsaF (black) and PsaL (red). (D) Root mean-square deviation (RMSD) of PsaF (red) and PsaL (black).

Fig. 9