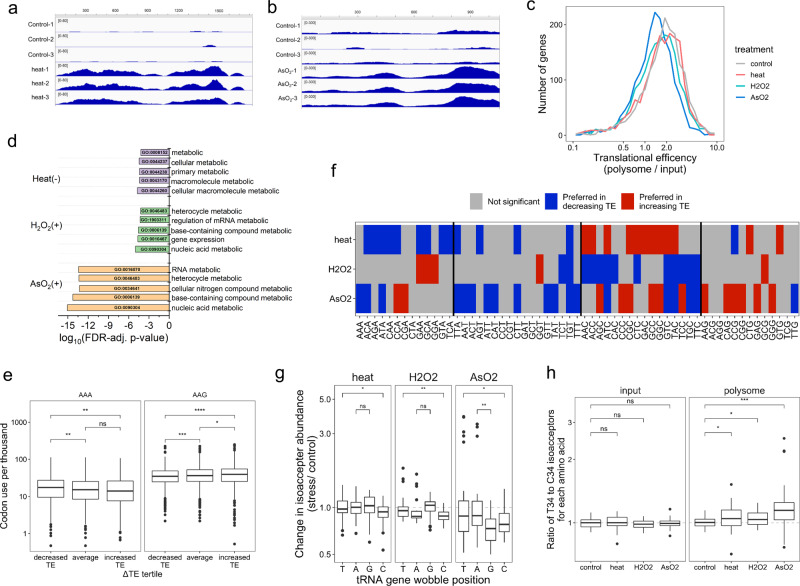
Fig. 5. mRNA analysis of total RNA and on polysome under stress.
mRNA-seq was performed in biological triplicates (n = 3) for each condition. Box and Whisker plots show median, 25th and 75th quartile, and whiskers to 1.5 times interquartile range. a IGV plot for the coding region of the HSP1A1 mRNA transcript, unstressed control (top), and heat stress (bottom) shows stress-increased read coverage along the length of the CDS. b IGV plot for the coding region of the ATF4 mRNA, unstressed control (top), and arsenite stress (bottom) showing stress-increased read coverage along the length of the CDS. c Histogram of translation efficiency (TE) among commonly detected mRNA genes in all conditions, in 30-gene increments. d Gene ontology analysis of biological processes among genes with stress-induced changes to TE. (+) Genes with highly increased translation efficiency, (−) Genes with highly decreased translation efficiency. e Lysine codon usage for AAA and AAG is compared between genes in the bottom, middle, and top tertile of ΔTE values during arsenite stress. ****p < 10−4, ***p < 10−3, **p < 0.01, *p < 0.05, ns not significant; significance calculated with two-sided Wilcoxon test. Data were shown for n = 3 independent biological replicates for n = 1747 genes, comparing tertiles. P values (top to bottom) for AAA are 2.6 × 10⁻³ and 9.5 × 10⁻³, and for AAG 1.7 × 10⁻⁸, 4.3 × 10⁻², and 3.5 × 10⁻⁴. f Heat map showing significant differences in codon use between genes with increasing versus decreasing TE during stress. Significance is computed as Wilcox test p < 0.05 for comparing codon use between genes in the top and bottom tertile of ΔTE values for each stress. The heat map shows codons preferred by genes with increasing TE (red) or decreasing TE (blue) (g) tRNA abundance change on the polysome for isoacceptors with different wobble anticodon nucleotide in the tRNA gene. **p < 0.01, *p < 0.05, ns not significant; significance calculated with two-sided Wilcoxon test. Data were shown for n = 3 independent biological replicates for 42, 24, 24, and 48 isodecoders with wobble nucleotide T, A, G, or C, respectively. P values (top to bottom) for heat: 1.3 × 10⁻² H2O2: 2.3 × 10⁻³ NaAsO2: 1.5 × 10⁻², 5.9 × 10⁻³. h tRNA abundance change of the ratios for T34 versus C34 wobble anticodon tRNA for each amino acid, total RNA input on the left, and on the polysome on the right. ***p < 10−3, *p < 0.05, ns not significant; significance calculated with two-sided Wilcoxon test. Data were shown for n = 3 independent biological replicates for 11 amino acids. P values (top to bottom) for polysome are 7.4 × 10⁻⁴, 2.4 × 10⁻², 3.7 × 10⁻².

