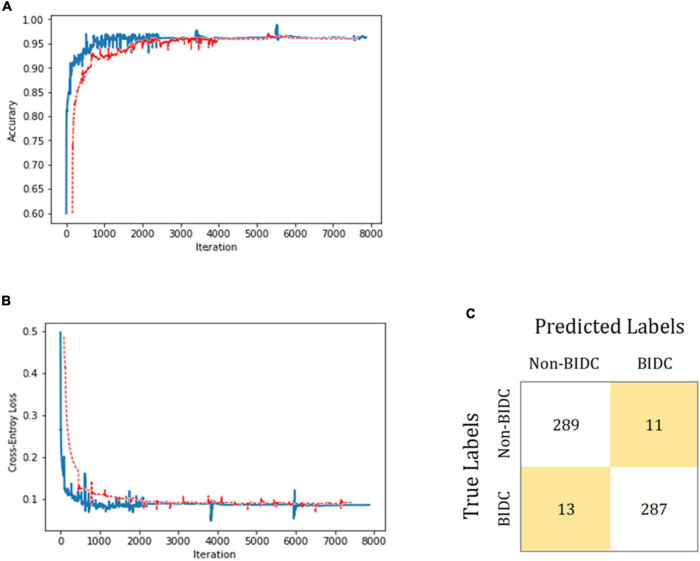
FIGURE 5.
BIDC diagnosis transfer-learning performance using breast tissue microscope slide images. In (A,B), the training and test datasets are shown in blue and red, respectively. The classification accuracy is plotted against training epochs, and in (B), the categorical cross-entropy loss is shown as a function of training epochs for the binary classification problem. The curve is smoothed. (C) Shows the model-classification confusion matrix for test image classification. As shown, the proposed model successfully classifies BIDC from non-BIDC images.

