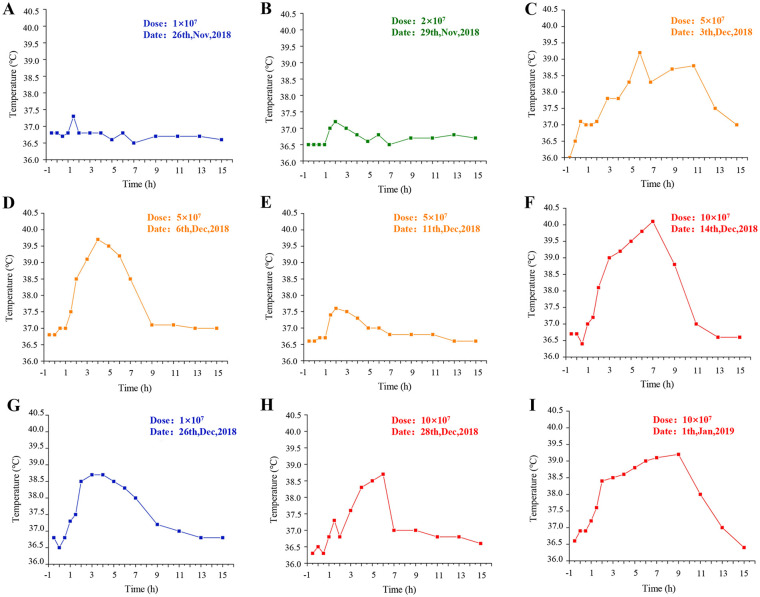
Figure 1.
Profiles of the patient’s body temperature after chimeric costimulatory converting receptor-NK92 cell injection. (A–C). The body temperature curve at first cycle of cell therapy. (D–F). The body temperature curve at second cycle of cell therapy. (G–I). The body temperature curve at third cycle of cell therapy.

