
Figure 4. The computational framework used to predict the serological response to flu vaccination.
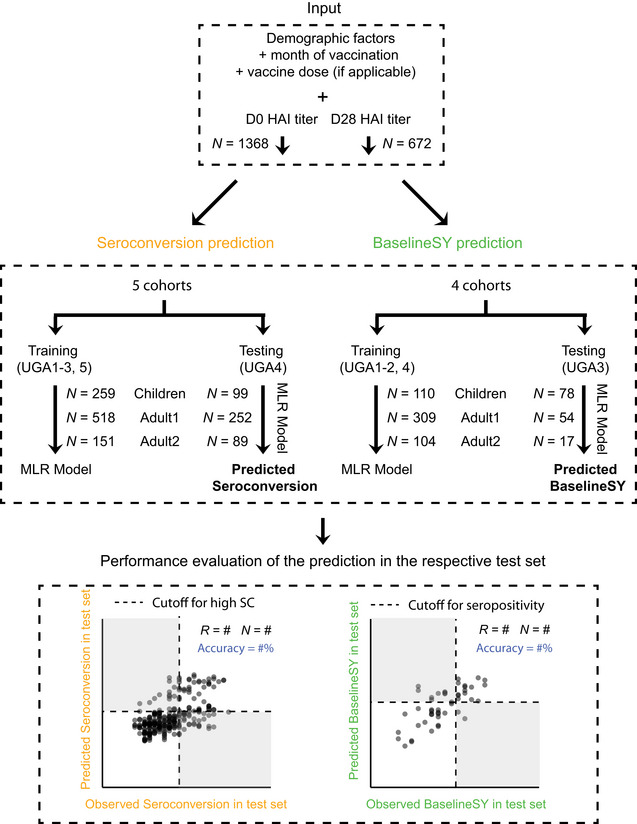
Variables for Seroconversion prediction and BaselineSY prediction, respectively, in each of the three subpopulations, and machine learning strategy used to predict Seroconversion and BaselineSY. We used two metrics to evaluate the performance of the models: correlation coefficient (R) and accuracy (%) of values observed in the test dataset (UGA4) compared to values predicted for the test dataset (UGA4) using the models trained on UGA1‐3 and UGA5. Accuracy describes the extent to which we correctly predicted the category. Cutoffs for high seroconversion and seropositivity are the same as those in Fig 2. Dashed lines mark the cutoff for high seroconversion (≥ 8) or seropositivity (≥ 4*log2(40)), respectively. White and grey quadrants show areas of correct and incorrect predictions respectively, used to calculate accuracy. All modeling, predicting, and evaluation have been done for the three subpopulations separately using UGA1‐⅗ for training and UGA4 for testing. Percentages listed in blue denote correct predictions (accuracy). MLR, multiple linear regression.