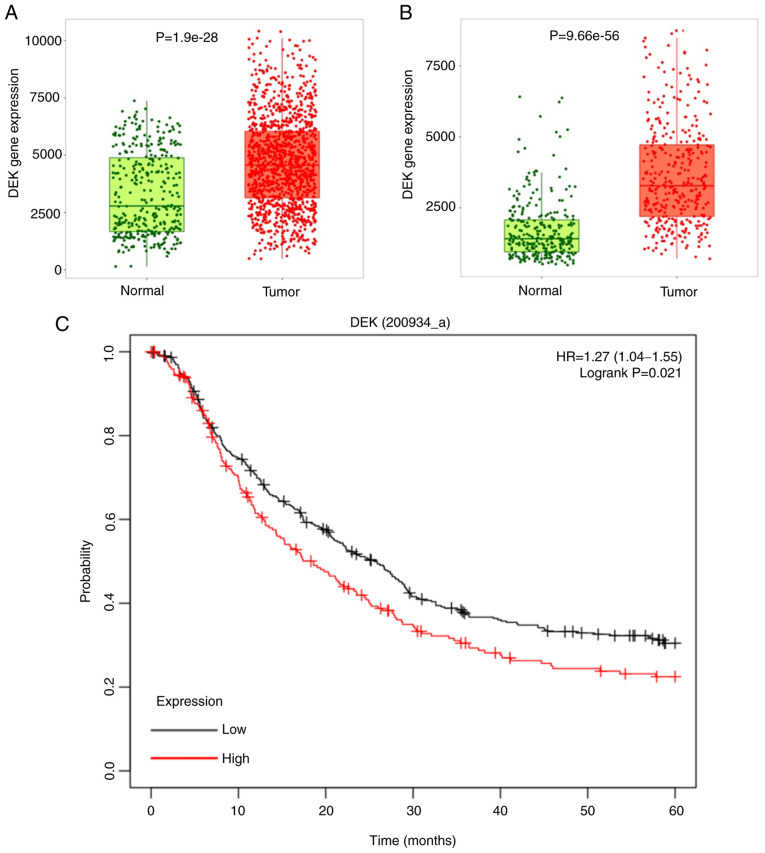
Figure 1.
Analysis of DEK expression levels in GC and normal gastric tissues from the GEO, TCGA, and GTEx database. (A) Expression of DEK in 360 normal and 1,221 GC samples was plotted as a box-and-whisker plot. The boxplot shows the difference in expression levels between normal and tumor tissues verified by the Wilcox test, and there was a statistically significant difference between the two (P=1.9×10⁻²⁸). In the boxplot, green and red dots represent the corresponding DEK gene expression levels of normal samples and tumor samples, respectively. In the box, the upper line of the box represents the upper quartile of DEK gene expression, and the lower line represents the lower quartile of DEK gene expression. Between the upper line and lower line of the box, the amount of DEK expressed in 50% of the normal and tumor samples is represented. The thick lines in the middle of the green and red boxes indicate the median expression of the DEK gene in normal and tumor samples, respectively. (B) The expression of DEK in 294 normal and 375 GC samples was plotted as a box-and-whisker plot as in A, and there was a statistically significant difference between the two (P=9.66×10−56). Statistical analysis was performed by Student's t-test; P<0.001. (C) Kaplan-Meier curve of GC patients stratified by high or low expression of DEK. Data were obtained from the following datasets. Expression levels of DEK (200934_at) from GSE14210 (N=145), GSE15459 (N=200), GSE22377 (N=43), GSE29272 (N=268), and GSE51105 (N=94). The difference was statistically tested using the log-rank test, P<0.05. GC, gastric cancer; GEO, Gene Expression Omnibus; TCGA, The Cancer Genome Atlas.

