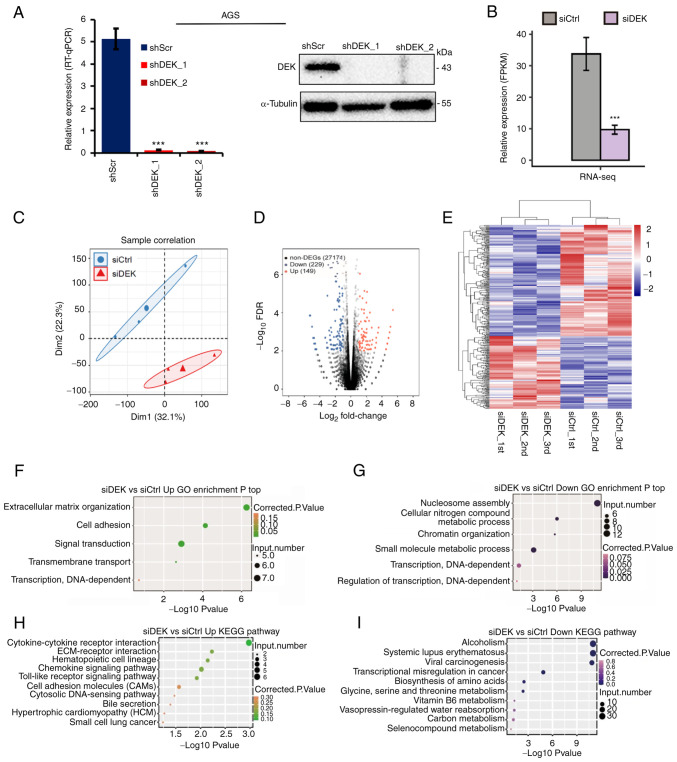
Figure 2.
Global picture of the DEK-regulated transcriptome in a human GC cell line AGS. (A) Relative mRNA expression levels of DEK (% of GAPDH) in shRNA-infected cells as assessed by RT-qPCR are shown in the left panel. Statistical differences between groups (shScr and either shDEK_1 or shDEK_2) were tested using one-way ANOVA with Newman-Keuls multiple comparisons test, and P<0.05 was considered statistically significant. Bars and error bars represent the mean ± SD, respectively (n=3), ***P<0.001. Protein levels of DEK and α-tubulin in shRNA-infected cells as assessed by immunoblots are shown with their molecular sizes (kDa) in the right panel. (B) DEK expression (FPKM value) was quantified by RNA-seq. Error bars represent mean ± SEM, ***P<0.001. (C) Principal component analysis of the six samples consisting of the biological triplicates of siCtrl- and siDEK-treated cells based on the normalized gene expression levels. The abscissa represents dimension 1, the ordinate represents dimension 2; the three small dots in the blue ellipse represent the three samples of the siCtrl group, and the large dot in the middle is the normalization of the siCtrl group again. The three small triangles in the red ellipse represent the three samples of the siDEK group, and the large triangle in the middle is the normalization of the siDEK group again. (D) A volcano plot for the identification of DEK-regulated genes. Significantly upregulated and downregulated genes are labeled in red and blue, respectively. (E) Hierarchical clustering of the DEGs in the siCtrl- and siDEK-treated AGC cells. FPKM values are log2-transformed and then median-centered by each gene. Expression values are indicated as gradient blue-to-red colors as indicated at the right side of the figure. (F and G) The five and six GO biological processes of the upregulated and downregulated genes, respectively. Corrected P-values and annotated gene numbers in each category are indicated as colors and sizes of the dots, respectively, as indicated at the right sides of each figure. (H and I) The top 10 representatives KEGG pathway of the upregulated and downregulated genes, respectively. Corrected P-values and annotated gene numbers in each category are indicated as colors and sizes of the dots, respectively, as indicated at the right sides of each figure. GC, gastric cancer; FPKM, fragments per kilobase of transcript per million fragments mapped; DEGs, differentially expressed genes; GO, Gene Ontology; KEGG, Kyoto Encyclopedia of Genes and Genomes.

