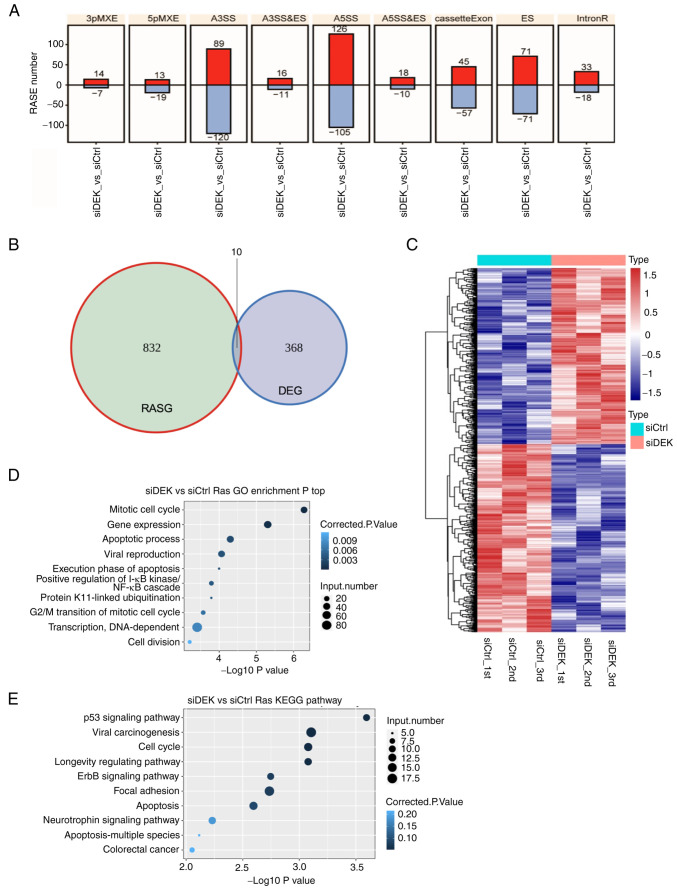
Figure 5.
Global picture of the RASEs that are regulated by DEK. (A) Frequency distributions of different types of DEK-regulated ASEs. Red and blue bars represent the increase and decrease in the numbers of RASEs in the siDEK condition, respectively. The y-axis represents the number of genes. (B) The overlap between DEGs and DEK-regulated ASEs is shown as a Venn diagram. Numbers represent gene numbers in each category. (C) Hierarchical clustering of the frequencies of ASEs in genes in the siCtrl and siDEK conditions. Frequencies of the ASEs are shown as gradient colors of blue and red, as indicated at the right side of the figure. (D and E) The top 10 most enriched pathways of GO biological processes and KEGG pathways among the RASGs. The corrected P-values and number of genes in each category are indicated as colors and sizes of dots, as indicated at the right sides of the figures. RASEs, regulated alternative splicing events; DEGs, differentially expressed genes; RASGs, regulated alternative splicing genes; GO, Gene Ontology; KEGG, Kyoto Encyclopedia of Genes and Genomes; A3SS&ES, alternative 3′splice site and exon skipping; A5SS&ES, alternative 5′splice site and exon skipping MXEs mutually exclusive exon.

