. 2019 Oct 21;9(58):33684–33692. doi: 10.1039/c9ra04679h

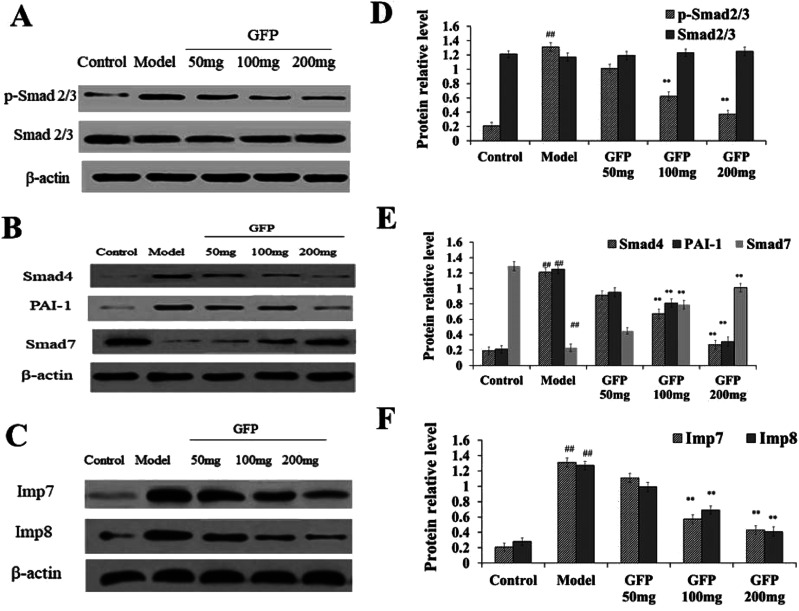
Fig. 5. (A) Effect of GFP on the protein expression level of p-Smad 2/3 and Smad 2/3 in liver tissue. (B) Effect of GFP on the protein expression level of Smad4,PAI-1and Smad7 in liver tissue. (C) Effect of GFP on the protein expression level of Imp7 and Imp8 in liver tissue. Histogram represents quantification of protein expression levels using ImageJ software. (D) Levels of p-Smad 2/3 and Smad 2/3. (E) Levels of Smad4, PAI-1and Smad7. (F) Levels of Imp7 and Imp8. The expression of protein was analyzed by western bolt. β-Actin was used as an equal loading control. #P < 0.05, ##P < 0.01 vs. control group, *P < 0.05, **P < 0.01 vs. model group, respectively.

Fig. 5