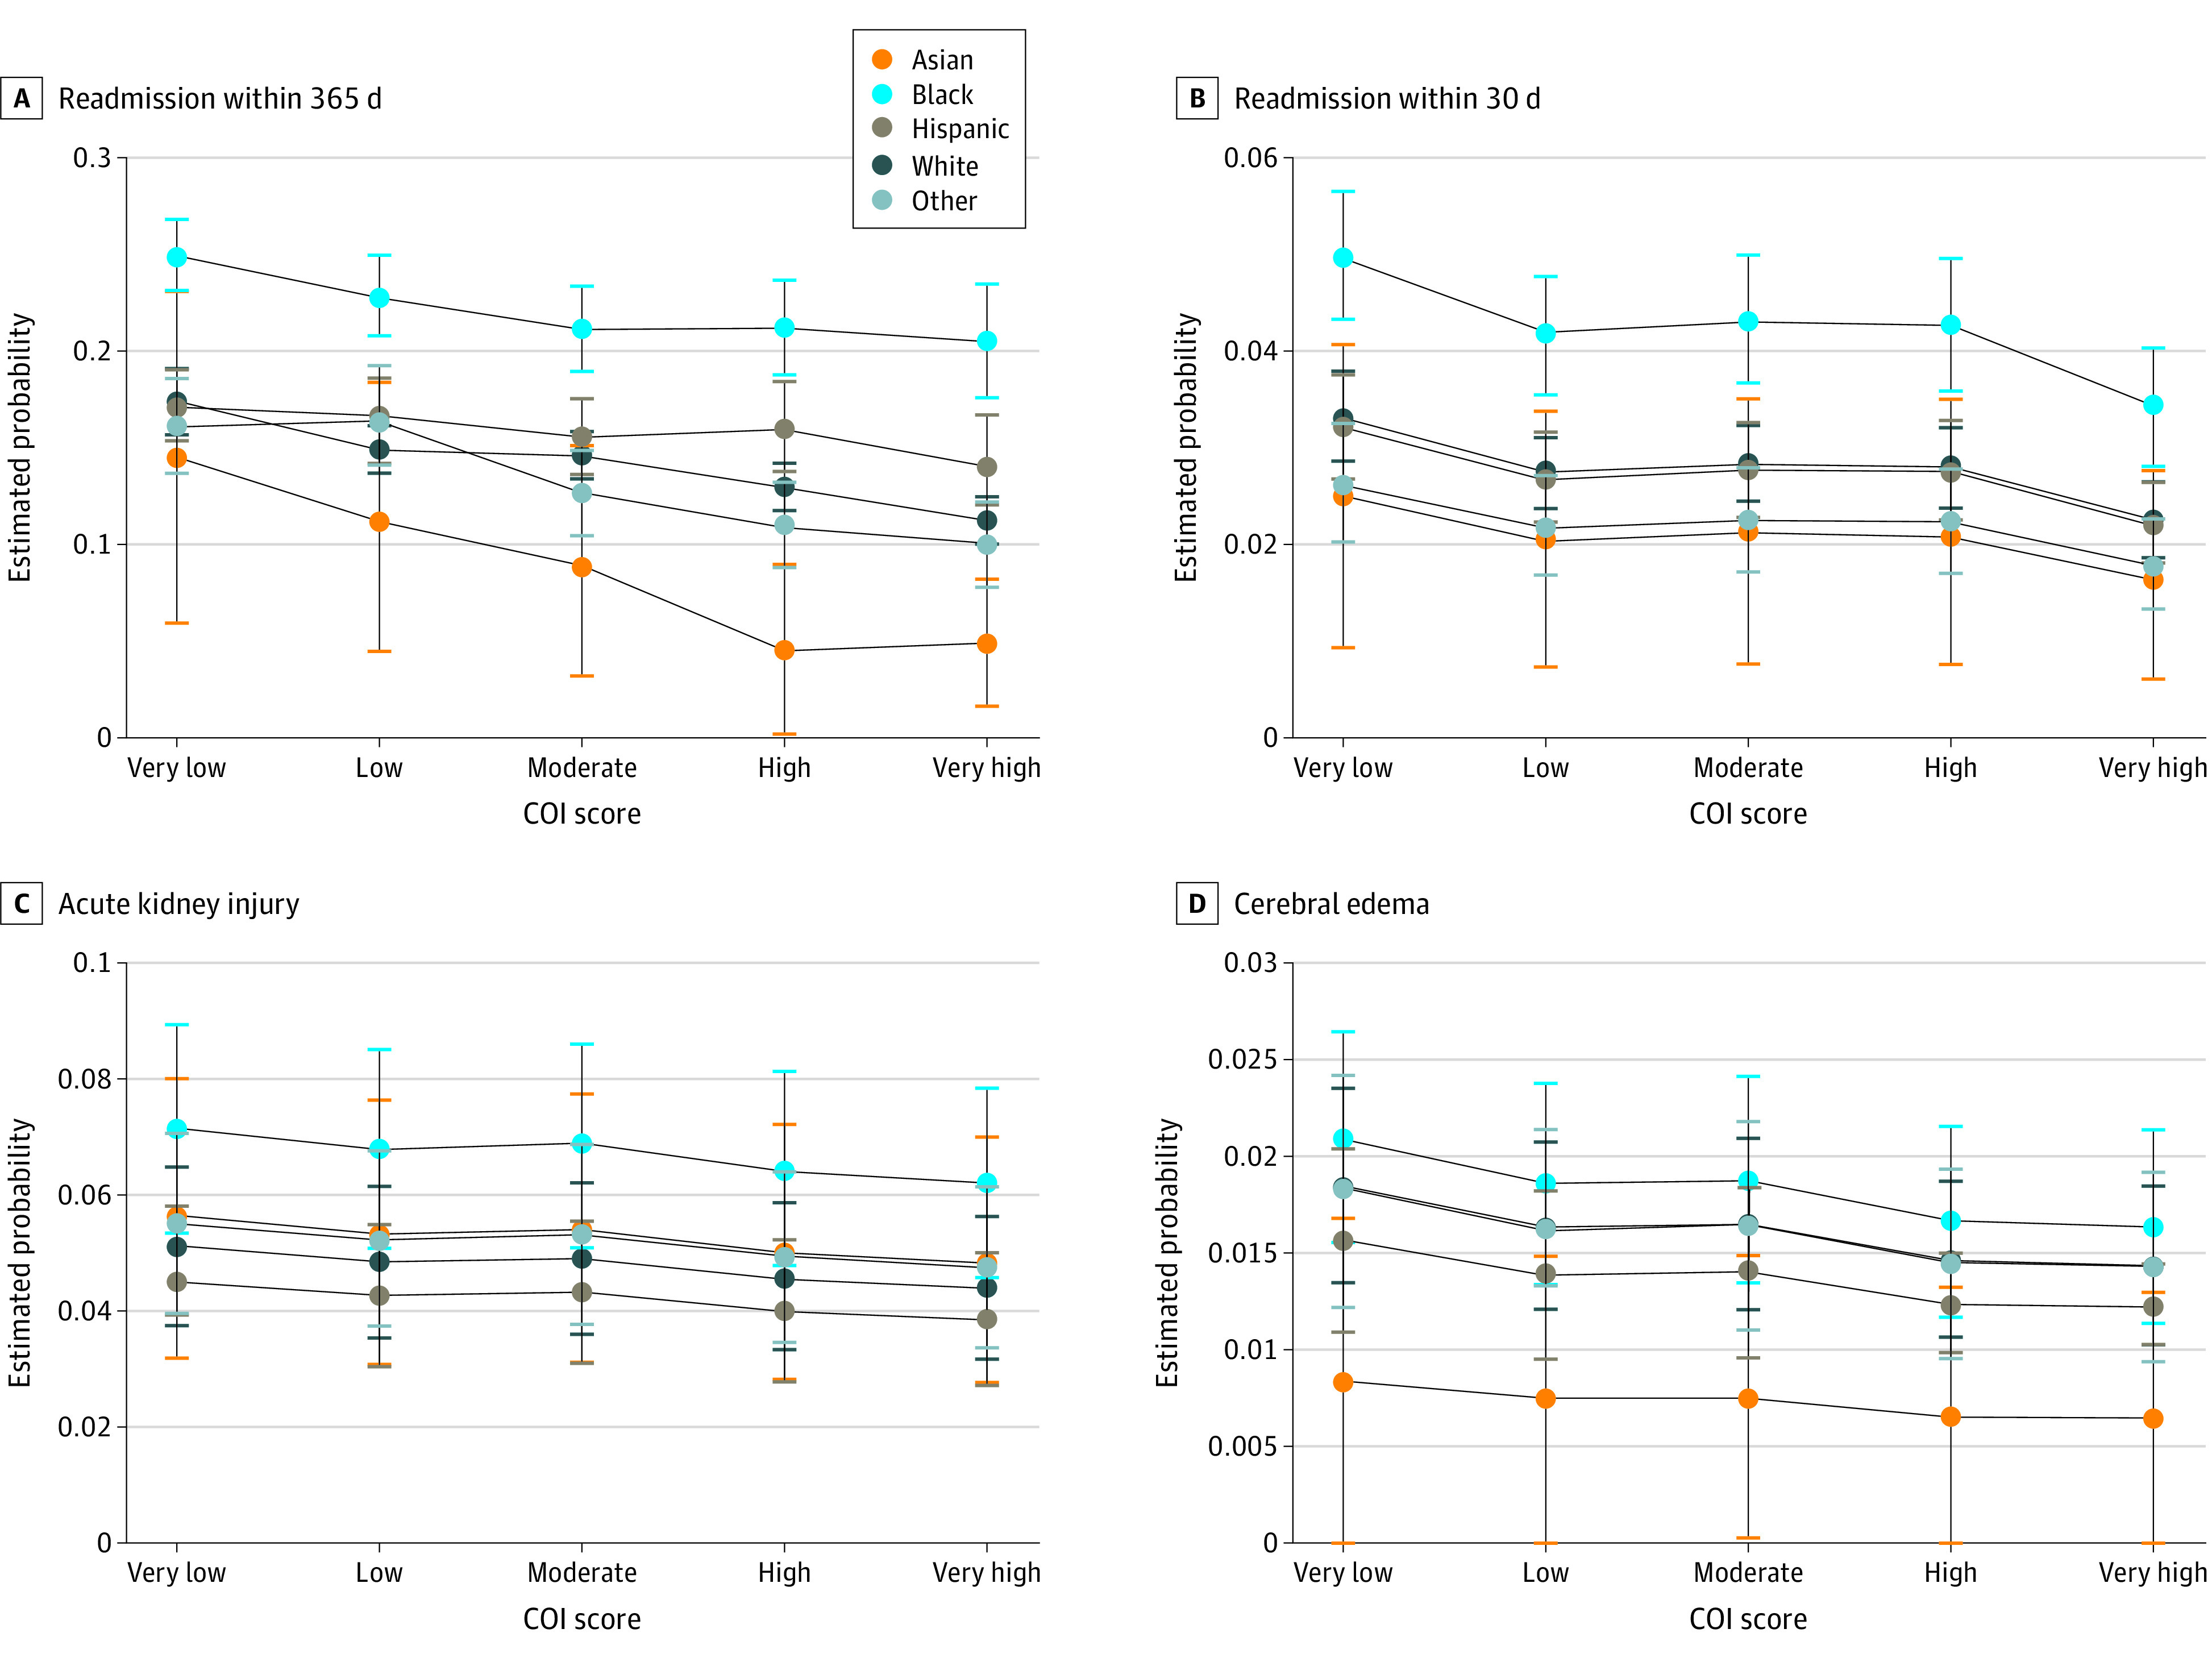
Figure 2. Probabilities of the Main Outcomes of Readmission and Diabetes-Related Complications by Race and Ethnicity and Overall Neighborhood Child Opportunity.

Child opportunity index 2.0 (COI) categorical scores at or below the 20th percentile were categorized as very low; greater than 20th to at or below the 40th percentile, as low; greater than 40th to at or below the 60th percentile, as moderate; greater than 60th to at or below the 80th percentile, as high; and greater than 80th percentile, as very high. Whiskers represent 95% CIs.
