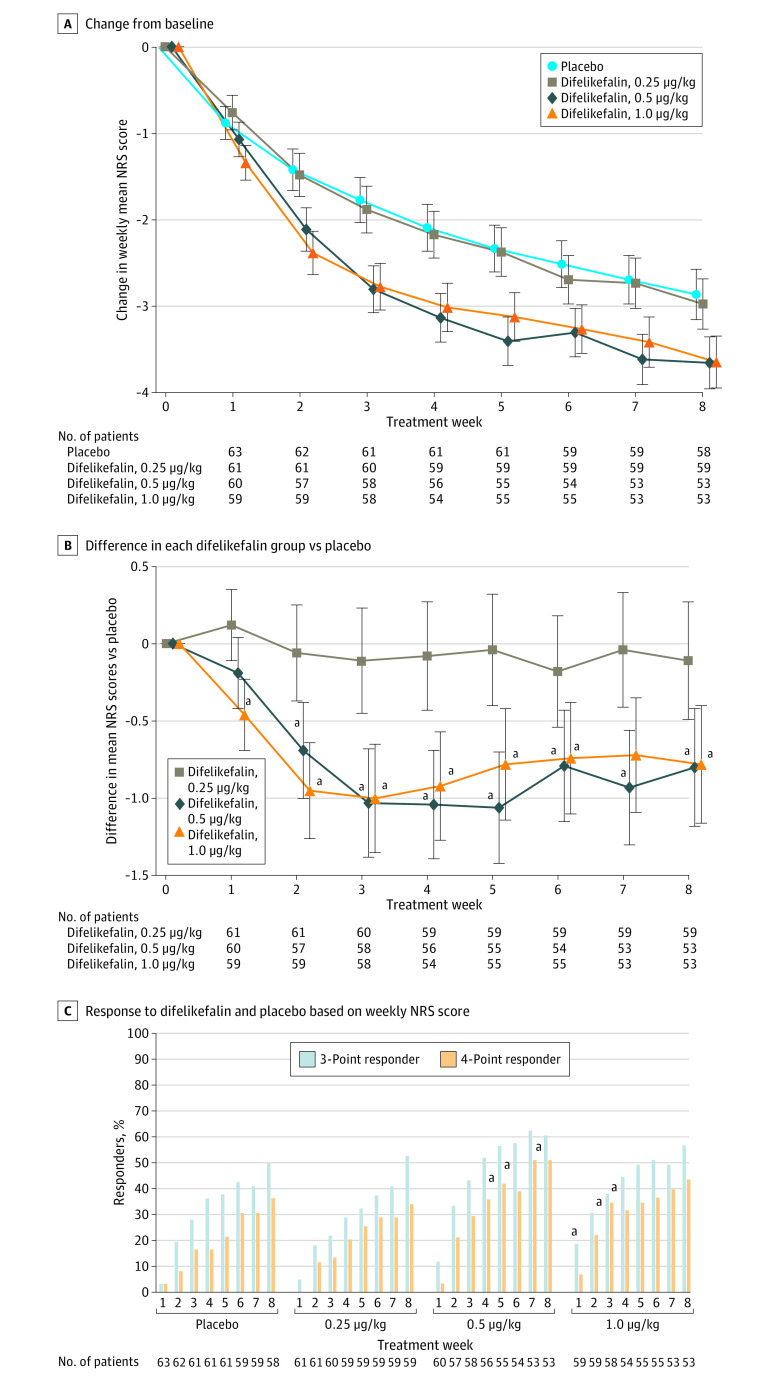
Figure 2. Course of the Primary Outcomes During 8-Week Treatment Period.
A and B, A mixed-effects model for repeated measures was used to compare the difelikefalin (0.25, 0.5, and 1.0 μg/kg) and placebo groups. C, A comparison between the difelikefalin (0.25, 0.5, and 1.0 μg/kg) and placebo groups was performed using the Fisher exact test. Error bars indicate SEs. NRS indicates Numerical Rating Scale.
aP < .05.

