
Figure 1.
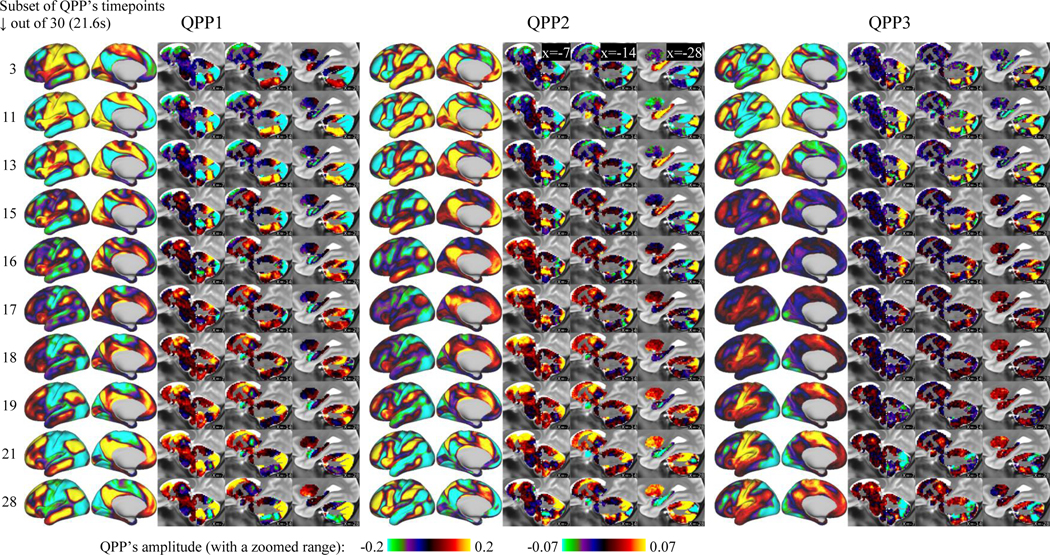
QPPs 1–3 involve coordinated propagation of activity along functional connectivity gradients across the whole brain. Each row corresponds to a timepoint of the QPP and shows the level of activation or deactivation of brain areas with warm and cool color ranges, respectively. For all 30 timepoints see Video 1.