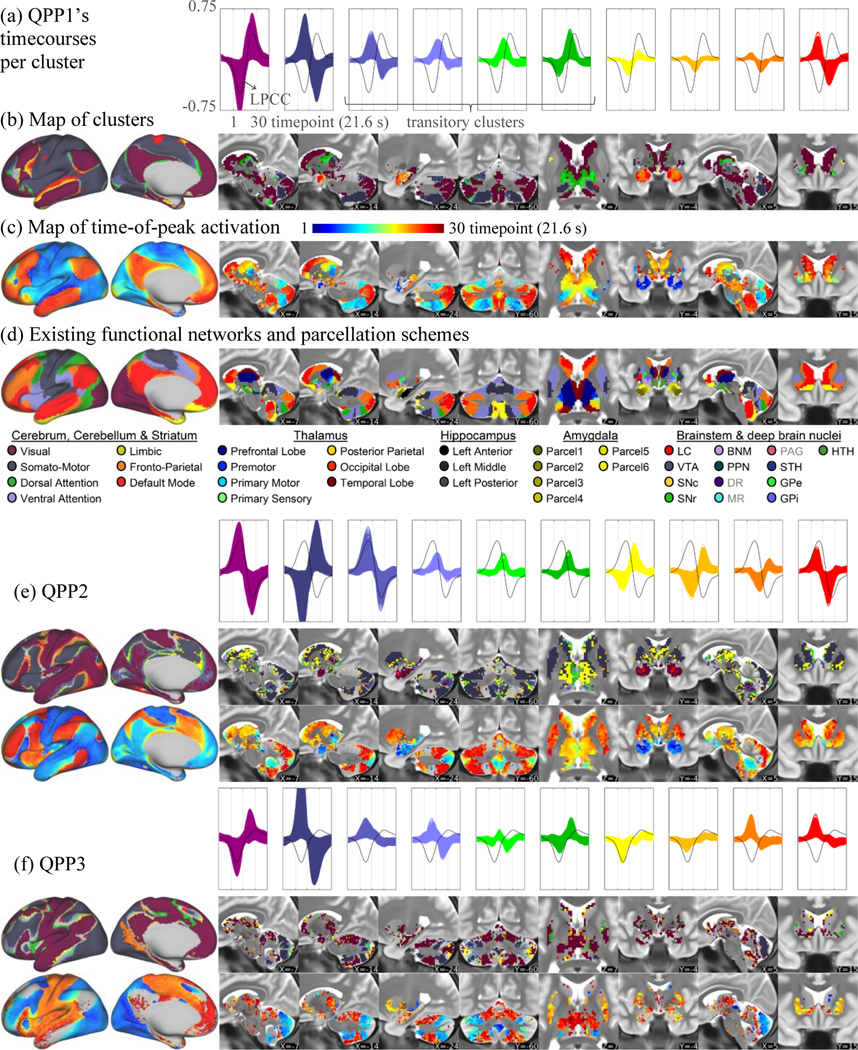
Figure 2.

Summary maps of activity within QPPs, illustrating coordinated propagation across the whole brain. (a) QPP1’s timecourses (plotted together) per cluster (LPCC timecourse in black for reference). (b) Brain areas, at the left cortical hemisphere and representative non-neocortical planes, color-coded based on correspondence with QPP1’s clusters. (c) Timepoints of peak activation of QPP1’s timecourses. (d) Existing functional networks and parcellations for comparison. QPPs 2 (e) and 3 (f).
