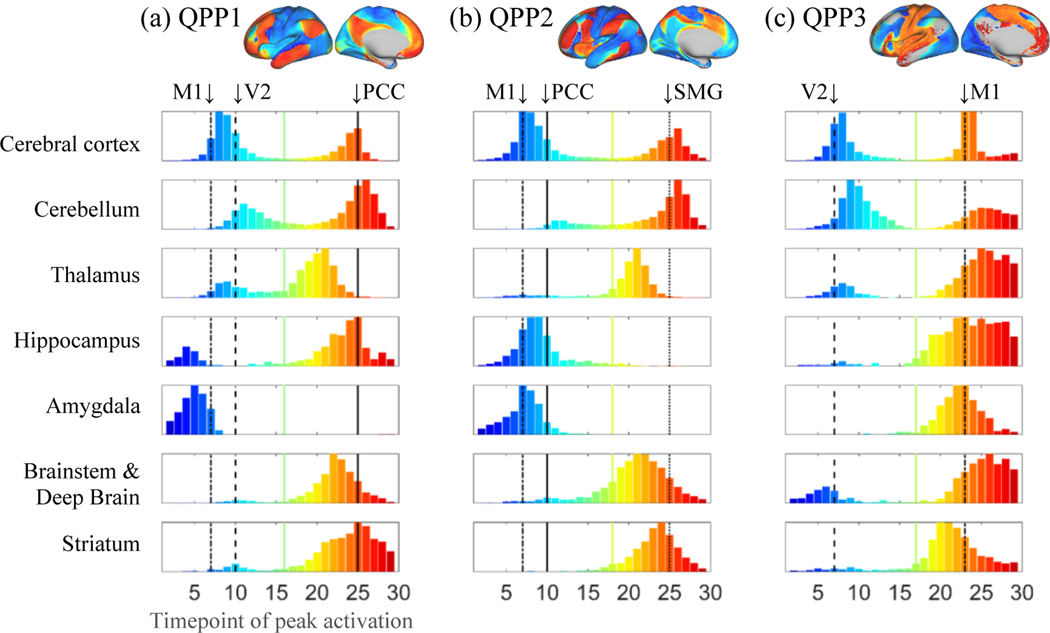
Figure 3.
The number of vertices/voxels with peak activity at each timepoint of QPPs 1–3 at each brain region. As qualitative references, the times of peak activity at the cortical areas of the left PCC (DMN node), V2, primary motor (M1) and supramarginal gyrus (SMG; FPN node) are plotted in black with unique line types. The distributions are mostly bimodal and the comparison of time difference between pairs of regions were done on the second mode, identified as the entries above the mid timepoint of the cortical distribution (indicated by the colored line for each QPP). Thalamic and brainstem and deep brain areas lead the cerebral cortex in QPPs 1 and 2 as activity propagates to the cortical nodes of FPN/DMN in QPP1 and the cortical nodes of FPN/VAN in QPP2. The cerebellum slightly lags the cerebral cortex in all QPPs.

