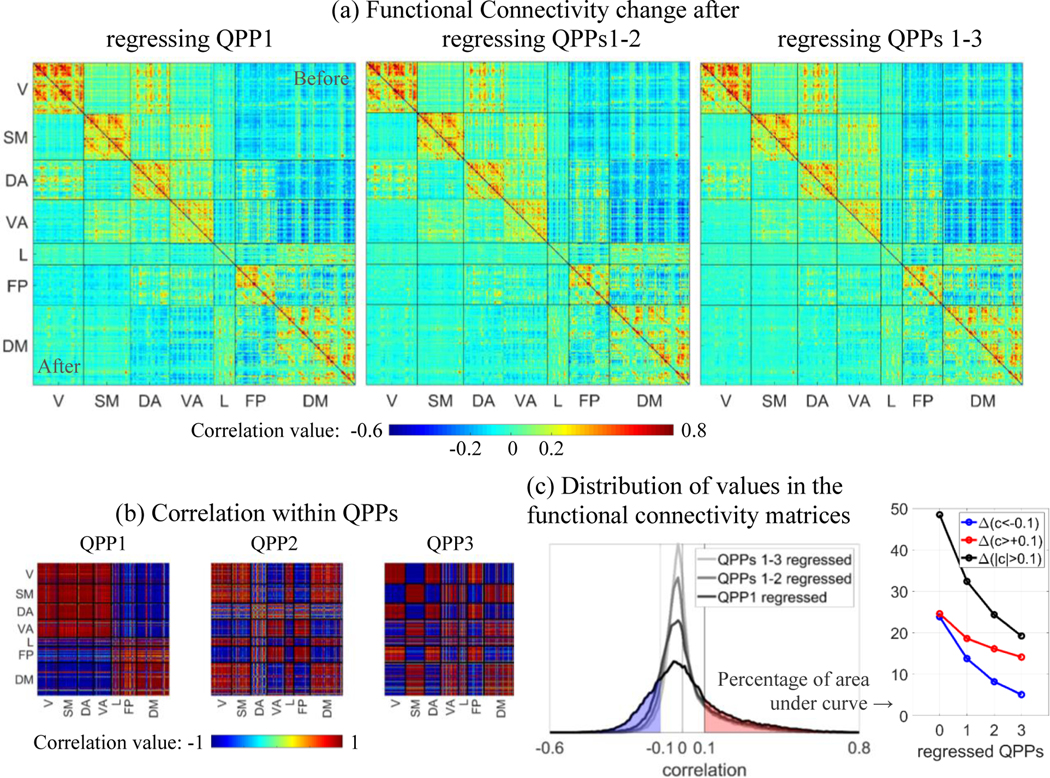
Figure 4.

Change in functional connectivity between pairs of areas after regressing QPPs. (a) For each matrix, the top right half is the functional connectivity between 360 cortical parcels ordered based on seven networks, before regressing any QPP, and the bottom left half is the functional connectivity after scan-wise regression of each QPP. Networks are visual (V), somatomotor (SM), dorsal attention (DA), ventral attention (VA), limbic (L), frontoparietal (FP) and default mode (DM). Regressing each QPP progressively reduces the correlation between pairs of areas, within and particularly between networks. Such reduction is consistent with the correlation within each QPP, shown in (b). (c) The distribution of correlation values for each functional connectivity half-matrix shown in (a), and the percent of the correlation values above 0.1 or below −0.1 for each case. Both positive and negative correlation values are progressively reduced by regression of QPPs, but the negative correlation values are more affected.
