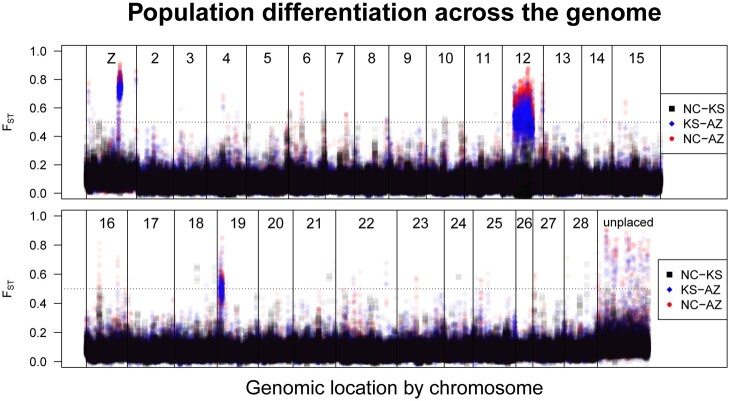
Fig. 3.
Pairwise differentiation (FST) across the M. sexta genome: North Carolina (NC) versus Kansas (KS; black squares), Kansas versus Arizona (AZ; blue diamonds), and North Carolina versus Arizona (red points). Plotting is ordered by chromosomal linkage. For ease of visualization, the genome is split into 2 rows. We examined regions enriched for differentiation greater than 0.5 (dashed line). By this metric, one peak on the Z, and one peak each on chromosomes 12 and 19. Additionally, note that the highest peaks almost always come from KS versus AZ and NC versus AZ, indicating that Arizona’s population is more distinct from the others than NC and KS are from each other. Chromosomes are numbered based on syntenic assignment of HiC scaffolds from the Gershman assembly. Unplace scaffolds are all those beyond the 28 main chromosomal scaffolds.

