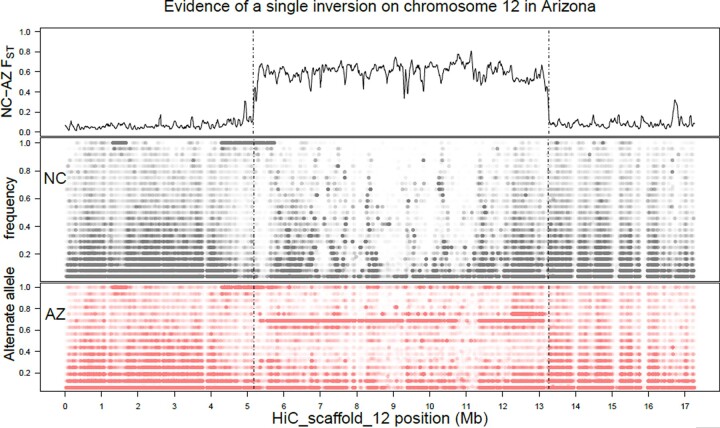
Fig. 4.
Evidence of a single segregating inversion on chromosome 12 from the newly released M. sexta assembly (Gershman et al. 2021). (Top) FST comparison for the North Carolina and Arizona populations shows a roughly 8 Mb region (between 5.4 and 13.2 Mb) of elevated differentiation between the populations, corresponding to the length of the 2 tracts of differentiation from Fig. 3, plus some additional unplaced peaks. Vertical dashed lines delimit this differentiated region as identified by Delly as an inversion and extend below for ease of comparison between populations. (Middle and bottom) Frequencies of alternate alleles for called SNPs in North Carolina (middle) and Arizona (bottom). Points are semitransparent such that opaquer regions are denser with variants. Arizona appears to hold the inverted orientation as a single allele frequency (0.6875 or 11/16) dominates the differentiated region, whereas North Carolinian allele frequencies are variable throughout. Also in the 1–2 and 4–5 Mb regions are areas of dense SNPs fixed in both populations. These are interpreted as regions in which the lab strain used to generate the reference has differentiated from the wild populations.

