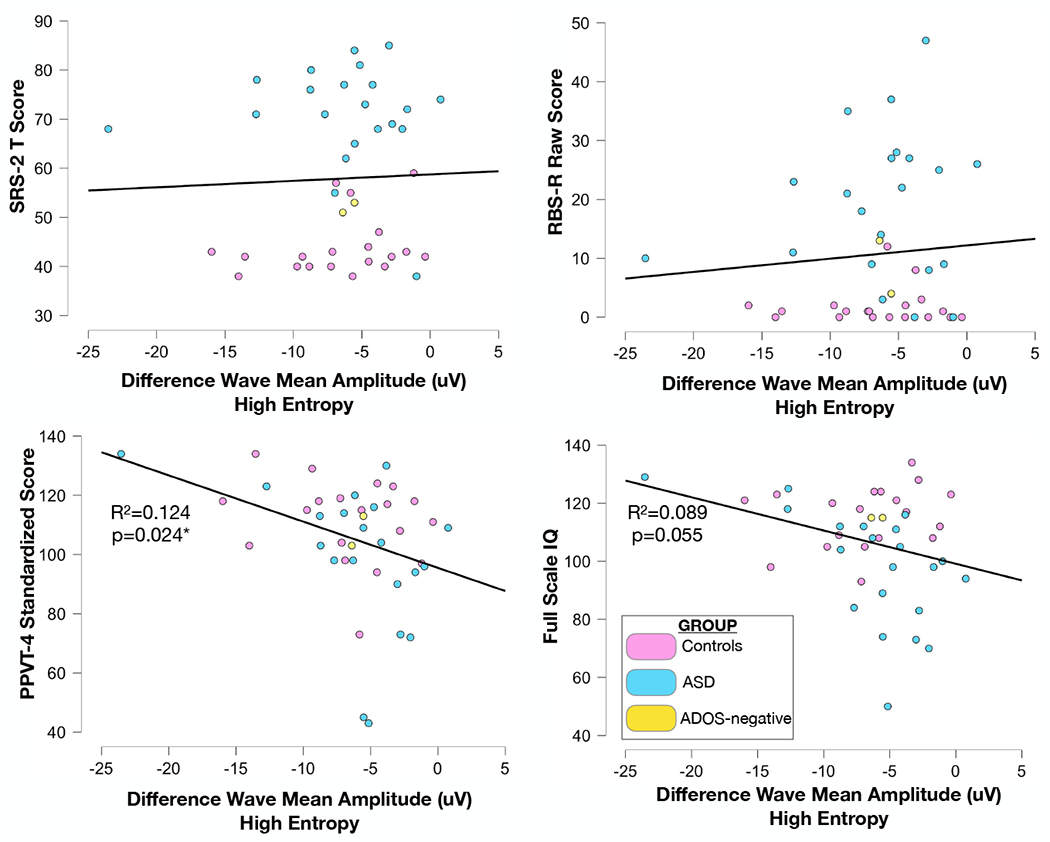
Figure 4.

Scatter plots depicting correlation between mean mismatch negativity (MMN) amplitude in the high entropy condition and A) SRS-2 T scores B) RBS-R raw scores and C) PPVT-4 standardized scores. Participant classification is represented by color as TD control (pink), ASD (blue), or previous ASD diagnosis, currently ADOS-2 negative (yellow). Stepwise linear regression identifies only the high entropy condition as significantly predictive of variance in PPVT-4 scores (R2=0.147, p=0.025). Other phenotypic measures show no relationship to MMN amplitude in any of the three entropy conditions.
