
Figure 7.
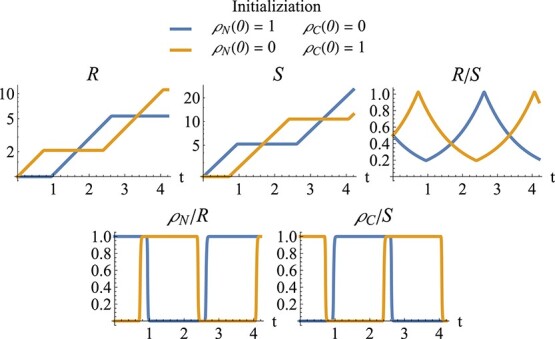
Simulations of root–shoot model, implemented with fast differential equations for the shared surplus of nitrogen and carbon,  and
and  . From left to right and top to bottom: root biomass (log scale), shoot biomass (log scale), ratio of root biomass to shoot biomass, rate of nitrogen shared by root (relative to root biomass) and rate of carbon shared by shoot (relative to shoot biomass). Blue curves: simulations are started with a high rate of nitrogen shared and a low rate of carbon shared (bottom right of Fig. 6); the system starts with only the shoot growing. Orange curves: simulations are started with a high carbon buffer and a low nitrogen buffer (top left of Fig. 6); the system starts with only the shoot growing. Parameters as in Fig. 6. Initial values for root and shoot correspond to the (fixed) values for these state variables in Fig. 6:
  and
and  .
.