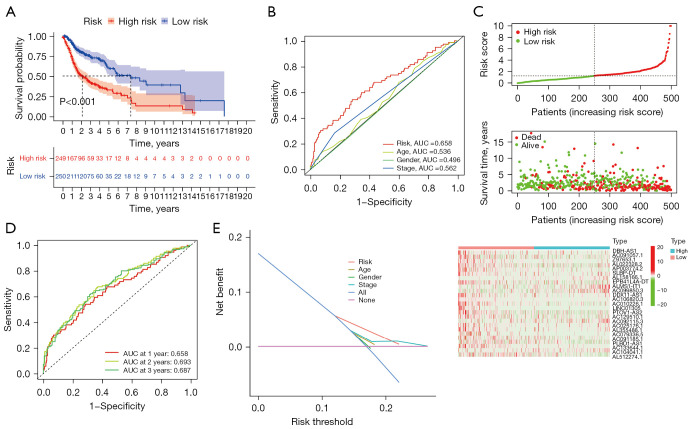
Figure 3.
Prognostic analysis of the ferroptosis-related lncRNAs in LUSC patients based on TCGA. (A) Kaplan-Meier survival curve analysis showed the survival time of patients with high-risk scores based on the ferroptosis-related lncRNAs prognostic signature was significantly poorer than those with low-risk scores (P<0.001). (B) ROC curve analysis showed the prognostic accuracy of ferroptosis-related lncRNAs prognostic risk scores and clinicopathological parameters such as age, gender, and stage. (C) Patients were ranked according to the risk score, and the correlation between survival time and risk scores was demonstrated using scatter plots. Heatmap shows the correlation between characteristic lncRNAs and the risk model. (D) The time-dependent ROC curves for 1-, 2-, and 3-year OS predictions by the risk score model in the TCGA-LUSC cohort. (E) The DCA of ferroptosis-related lncRNAs prognostic risk scores and clinicopathological parameters such as age, gender, and stage. AUC, the area under the curve; lncRNA, long non-coding RNA; LUSC, lung squamous cell carcinoma; TCGA, The Cancer Genome Atlas; ROC, receiver operating characteristic; DCA, decision curve analysis; OS, overall survival.

