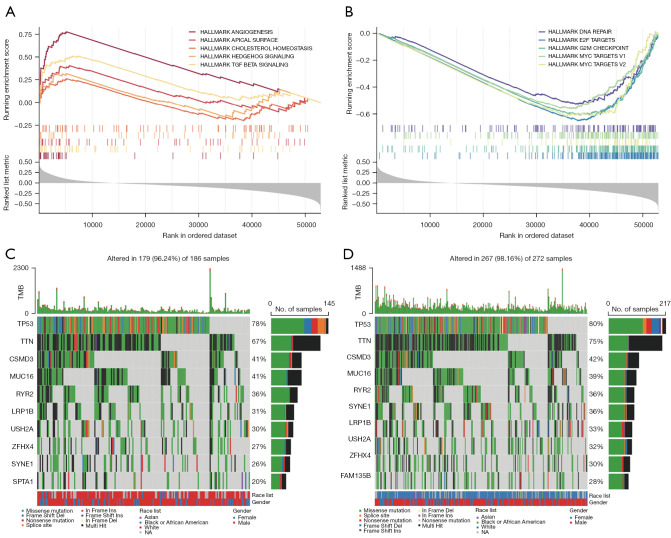
Figure 7.
Molecular characteristics of patients in the high- and low-risk group. (A,B). The GSEA analysis in the high- and low-risk group to enrich characteristic gene sets (P<0.05, FDR <0.29). (C,D) Significantly mutated genes in LUSC patients in the high- and low-risk group. The top 10 mutated genes in each group ranked by mutation rate are shown. The mutation rate is shown on the right, and the mutation counts are shown on the top. TMB, tumor mutation burden; NA, no answer; GSEA, gene set enrichment analysis; FDR, false discovery rate; LUSC, lung squamous cell carcinoma.

