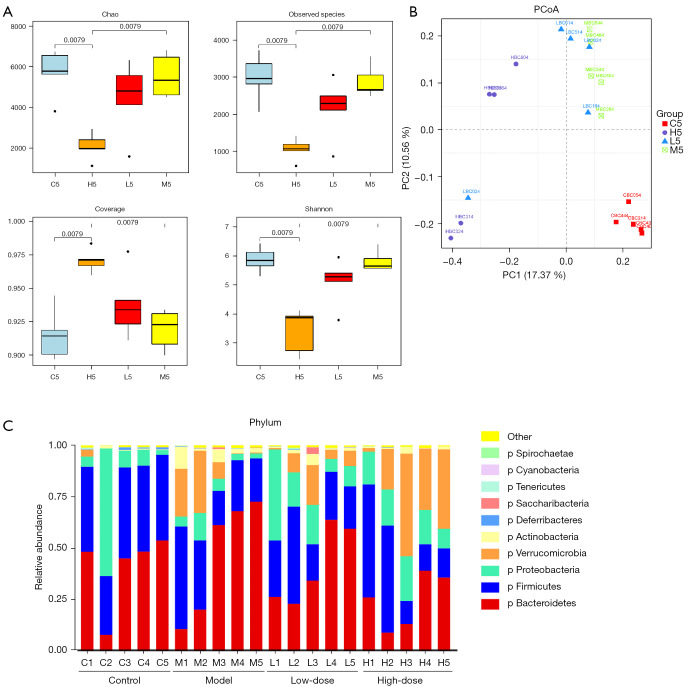
Figure 3.
Gut microbiota profile alteration induced by GC-K. (A) Alpha diversity at 13 weeks; (B) beta diversity at 13 weeks; (C) bacterial annotation at the phylum level. The labels of X axis consist of capital letters and Arabic numerals. C, M, L, and H mean control, model, low-dose, and high-dose group, respectively; 1, 2, 3, 4, and 5 indicate time points at 0, 7, 9, 11, and 13 weeks, respectively (n=5). PCoA, principal coordinates analysis; GC-K, ginsenoside compound K.

