Figure 2.

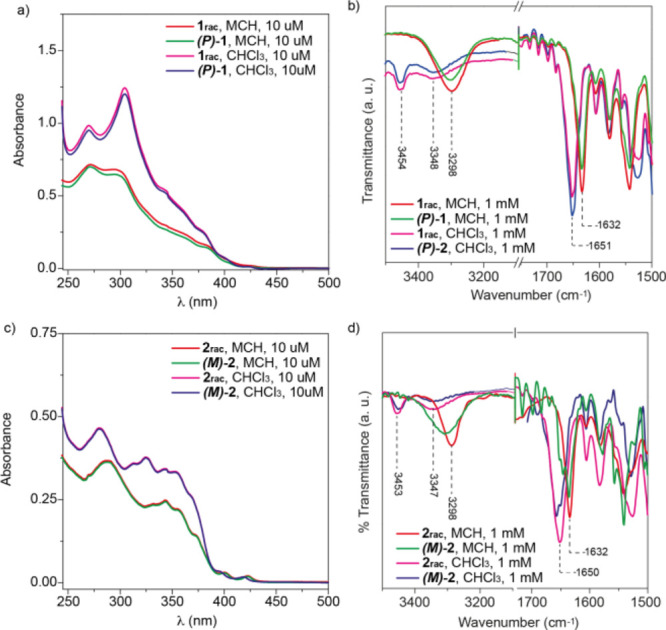
(a,c) UV–vis and (b,d) FTIR spectra of 1rac, (P)-1, 2rac, and (M)-2 in CHCl3 and MCH (experimental conditions for UV–vis spectra: 298 K, cT = 10 μM).

(a,c) UV–vis and (b,d) FTIR spectra of 1rac, (P)-1, 2rac, and (M)-2 in CHCl3 and MCH (experimental conditions for UV–vis spectra: 298 K, cT = 10 μM).