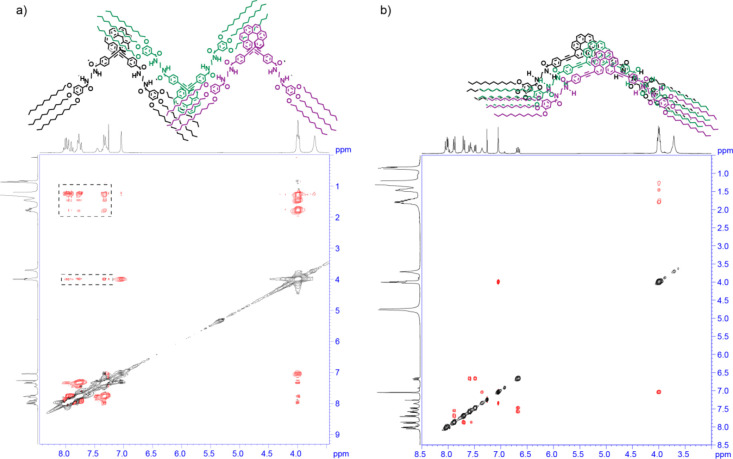
Figure 3.
ROESY NMR spectra (CDCl3, 300 MHz, cT = 20 mM; 293 K) of (a) (P)-1 and (b) (M)-2. The dotted rectangles depict the intermolecular through-space coupling signals. The upper part of the panel depicts a schematic illustration of the binding mode experienced by the reported [6]helicenes upon self-assembly.

