Figure 5.
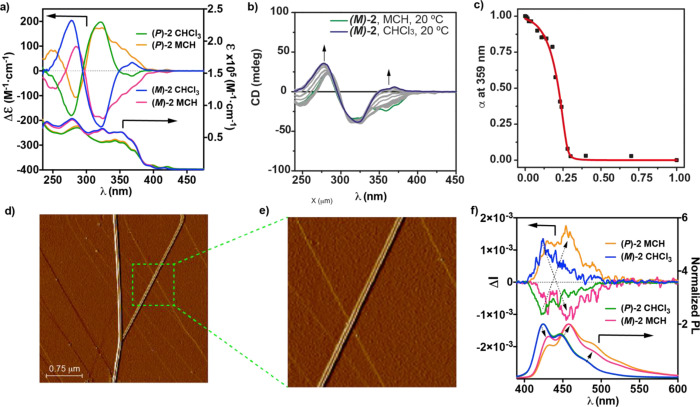
(a) ECD/UV–vis spectra of (P)-2 and (M)-2 in monomeric and aggregated states (CHCl3 and MCH, respectively). (b) CD spectra and (c) denaturation curve of (M)-2 in MCH/CHCl3 mixtures. The red line in panel (c) depicts the fit to the SD model. (d,e) AFM images of the helical fibers formed upon the supramolecular polymerization of (M)-2 (experimental conditions: HOPG as the surface; cT = 10 μM, and MCH as the solvent). (f) CPL/PL spectra of (P)-2 and (M)-2 in monomeric and aggregated states (CHCl3 and MCH, respectively) (experimental conditions for UV–vis, ECD, CPL, and PL spectra: cT = 10 μM and λexc = 365 nm; the dashed arrows in (f) depict the changes in the PL and CPL spectra).

