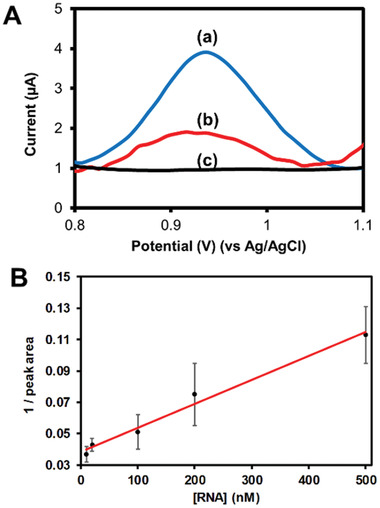
Figure 2.

A) DPV curves corresponding to (c) activated 3D‐PP, (a) ssDNA antisense oligonucleotide of SARS‐COV‐2 absorbed on 3D‐PP genosensor and (b) 3D‐PP genosensor incubated with 500 × 10−9 m SARS‐COV‐2 RNA solution. DPV conditions: Pulse amplitude 50 mV, step potential 10 mV, scan rate 20 mV s–1 PBS pH 7.4. B) Calibration curve: Inverse peak area versus SARS‐CoV‐2 RNA concentration.
